
Electric cars lose their spark

Thomas Edison built an electric car exactly 100 years ago (above) but it hit the same rock that bedevils electric cars to this day: The low power-to-weight ratio of storage batteries. An excellent example of the adage: "Those who will not learn from the past are doomed to repeat it"
Is the Electric Car Revolution Running Out of Juice? It depends on whom you ask:
* Year-to-date sales of the electric Nissan (NSANY) Leaf are down over 30%.
* Ford (F) had sold just 177 of its electric Focus through August.
* At the same time, production of Tesla Motors' (TSLA) hot-looking -- and expensive -- Model S sedan is sold out for months to come.
* Meanwhile, the Chevy Volt is selling a bit better lately -- but that's a mixed blessing for General Motors (GM).
How to Lose Money on a $39,995 Sale
Why are improving sales for the Volt a mixed blessing? It turns out that those sales are expensive ones: Reuters recently reported that GM is losing a bundle on each Volt it sells -- despite the little plug-in hybrid's steep $39,995 base price.
While GM took issue with Reuters' math, it's clear that the innovative car isn't a moneymaker for General Motors. With sales of just a few thousand in the best of months, it'll be many years before the car manages to repay its development costs, estimated at over $1 billion.
Now, that's not necessarily a bad thing, at least in GM's view. Like other automakers, GM is looking ahead toward the next decade, when fuel-economy rules will be much stricter. From the General's perspective, the Volt represents an early investment in the kind of technology that GM -- and other automakers around the world -- will need to perfect before those rules go into effect.
There's some validity to that argument. But that hasn't stopped GM's critics from complaining that electric-car technology is turning into an expensive boondoggle.
Will Electric Cars Ever Take Off?
A Washington Post editorial this week took the Volt to task, as part of a larger argument against the U.S. government's subsidies of electric car technology. The Department of Energy said in 2011 that there could be 1 million electric cars on U.S. roads by 2015, but as the Post points out, that's looking pretty unlikely right now.
The Department of Energy's conclusion was based on a study that made some assumptions that look kind of silly now. It expected Nissan to sell 25,000 Leafs this year. But through August, the automaker had sold fewer than 5,000 here in 2012. It also predicted that GM would sell 120,000 Volts this year. The reality: Fewer than 14,000 Volts had been sold through August in the U.S. in 2012.
Both of these cars, like much of the still-emerging U.S. electric-car business, were heavily dependent on government aid. GM's massive bailout is no secret, but some of the other Department of Energy aid programs are less well-known: Among other grants and loans, Nissan received $1.5 billion in low-cost loans to refurbish the Leaf's Tennessee factory, and Tesla got a $465 million line of credit to help get the Model S into production.
And what are taxpayers getting for all that? Not a whole lot.
SOURCE
How the IPCC fools everyone that CO2 drives climate instead of the Sun
The IPCC claims that only an increase in man-made greenhouse gases can explain most of the global warming observed during the 20th century. To justify this position, the IPCC programs computer models with multiple dubious assumptions, such as in the graph below showing assumed values in the models:
1. Greatly exaggerated, alleged radiative forcing at the top of the atmosphere from increased greenhouse gases [mostly CO2] of 2 W/m2 from 1959-2000, even though the "IPCC formula" found in the fine print of AR4 predicts a much smaller change of 0.837 W/m2 [58% less] during the same period [5.35*ln(369.52/315.97) = 0.837 W/m2].
2. No change in forcing due to changes in cloud cover, even though multiple papers show a decrease in cloudiness observed in the late 20th century could alone account for all observed global warming.
3. The false assumption that the effect of solar radiation on the Earth's surface can be modeled by tiny changes in Total Solar Irradiance [TSI] at the top of the atmosphere, shown in the graph below as the blue line. The models falsely assume there has been no change in solar radiation at the Earth surface from the 1930's to the end of the 20th century. In reality, multiple papers have shown the effects of solar radiation at the Earth surface are greatly modified and amplified by changes in clouds, ozone, large changes in solar UV and the solar magnetic field, aerosols, and other factors. Observations have shown swings of solar radiation at the Earth surface of 5 W/m2 over the past 18 years alone [1987-2005], far more than the ~0.25 W/m2 ripples and zero net change of TSI assumed in the blue line below.
4. That the effects of volcanic eruptions are accurately modeled, even though this has been shown to be false, and which also has large effects upon solar radiation at the Earth surface.
5. That long-term trends in ocean oscillations can be ignored in the models, and which also have been shown to correlate with solar activity.
6. That chaotic systems [the ultimate example of which is the climate] can be modeled by linear assumptions.
7. That increased CO2 will cause an increase in atmospheric water vapor, even though observations show a decline in atmospheric water vapor.
The IPCC climate models are little more than computer games built upon multiple absurd assumptions and circular reasoning. They do, however, serve the purpose of fooling most of the people, all the time.

Radiative forcing assumptions in IPCC computer models.

Another source of assumptions programmed in the models
SOURCE (See the original for links)
New paper shows how natural changes in ozone may drive climate
A important paper published today in the Journal of Geophysical Research finds that large quantities of ozone [O3], a "major greenhouse gas," are being produced naturally by an increase in lightning activity "caused by the influx of aerosols from a volcano."
According to the authors, "Our findings thus suggest a stronger O3 historical radiative forcing because this link implies lower lightning-generated [nitrous oxide] and lower O3, especially in the upper troposphere, in preindustrial time. Aerosol forcing therefore has a warming component via its effect on O3 production and this component has mostly been ignored in previous studies of climate forcing related to O3 and aerosols."
Prior research has shown that large variations in solar UV activity also control ozone production and that ozone levels could be the main driver of recent climate. Once again, natural variability including changes in ozone, solar and volcanic activity have been shown to be important drivers of climate.
JOURNAL OF GEOPHYSICAL RESEARCHSOURCE (See the original for links)
Aerosol indirect effect on tropospheric ozone via lightning
By Tianle Yuan et al.
Tropospheric ozone (O3) is a pollutant and major greenhouse gas and its radiative forcing is still uncertain. Inadequate understanding of processes related to O3 production, in particular those natural ones such as lightning, contributes to this uncertainty. Here we demonstrate a new effect of aerosol particles on O3 production by affecting lightning activity and lightning-generated NOx.
We find that lightning flash rate increases at a remarkable rate of 30 times or more per unit of aerosol optical depth. We provide observational evidence that indicates the observed increase in lightning activity is caused by the influx of aerosols from a volcano. Satellite data analyses show O3 is increased as a result of aerosol-induced increase in lightning and lightning produced NOx. Model simulations with prescribed lightning change support the satellite data analysis.
O3 production increase from this aerosol-lightning-ozone link is concentrated in the upper troposphere, where O3 is most efficient as a greenhouse gas. Our findings thus suggest a stronger O3 historical radiative forcing because this link implies lower lightning-generated NOx and lower O3, especially in the upper troposphere, in preindustrial time.
Aerosol forcing therefore has a warming component via its effect on O3 production and this component has mostly been ignored in previous studies of climate forcing related to O3 and aerosols.
Sensitivity simulations suggest that 4-8% increase of column tropospheric ozone, mainly in the tropics, is expected if aerosol-lighting-ozone link is parameterized, depending on the background emission scenario.
We note, however, substantial uncertainties remain on the exact magnitude of aerosol effect on tropospheric O3 via lightning. The challenges for obtaining a quantitative global estimate of this effect are also discussed. Our results have significant implications for understanding past and projecting future tropospheric O3 forcing as well as wildfire changes and call for integrated investigations of the coupled aerosol-cloud-chemistry system.
Fewest Forest Fires On Record
There have been 47,437 forest fires this year. That is the smallest YTD total since the National Interagency Fire Center started tracking it in 2003. It is almost 25% below the mean and about one fourth of the 1938 total.
I live three miles from what was mindlessly described in June as Colorado’s largest fire on record. The usual crew of idiots declared that the fire would burn until the winter snows, but the fire was completely extinguished by summer rains by mid-July.
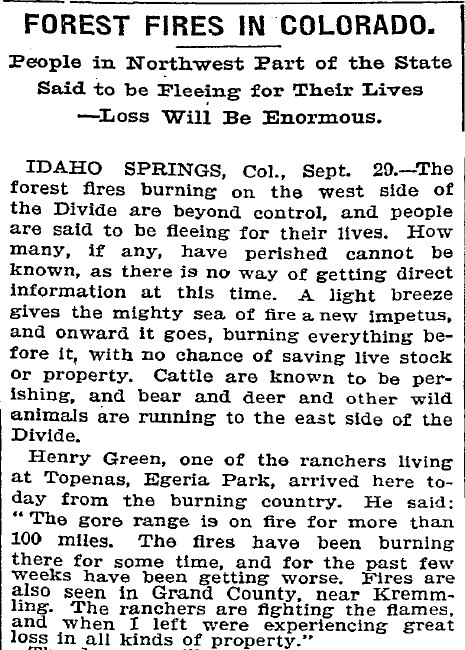
In late September 1898, a forest fire burned the entire northwest quadrant of the state. This year’s fire was about 1% that size, and it is cool and wet here in late September, 2012.
More HERE (See the original for links)
Paper finds 'brightening' of sunshine hours since 1980
A paper published in the Journal of Geophysical Research examined sunshine hours over the Iberian Peninsula from 1961-2004. The authors find a dimming of sunshine occurred from 1961 to the early 1980's, corresponding to the ice age scare of the time.
Conversely, the authors find, "Since the early 1980s, the [sunshine duration] series exhibit an upward trend or “brightening,” which corresponds to the subsequent warming period.
The authors also find a relationship between sunshine and atmospheric circulation patterns, stating, "Finally and perhaps surprisingly, the [total cloud cover] residual [sunshine duration] series exhibits a statistically significant relationship with a regional atmospheric circulation pattern during spring, summer, and autumn."
The IPCC, however, dismisses the role of the Sun in climate change by only examining small changes in Total Solar Irradiance [TSI], while ignoring sunshine hours at Earth's surface, the effect of cloud variations on sunshine, and amplifying factors on sunshine such as clouds/cosmic rays, ozone, large changes in solar UV and the solar magnetic field within and between solar cycles, solar effects on ocean oscillations and atmospheric patterns, etc., etc.
JOURNAL OF GEOPHYSICAL RESEARCH, VOL. 114, D00D09, 17 PP., 2009SOURCE
Dimming/brightening over the Iberian Peninsula: Trends in sunshine duration and cloud cover and their relations with atmospheric circulation
By Arturo Sanchez-Lorenzo et al.
Abstract
This study analyzes the spatial and temporal changes in sunshine duration (SunDu) and total cloud cover (TCC) over the Iberian Peninsula (IP) and four subregions during 1961–2004 using high-quality, homogenized data sets. The analyses confirm that over most of the IP and in most seasons, SunDu and TCC variations are strongly negatively correlated, with absolute values ∼0.8–0.9. Somewhat weaker correlations (0.5–0.6) are found in the southern portion of the IP in summer. A large discrepancy between the SunDu and TCC records occurs from the 1960s until the early 1980s when the SunDu series shows a decrease that it is not associated with an increase in TCC. This negative trend or “dimming” is even more pronounced after removing the effects of TCC via linear regression. Since the early 1980s, the SunDu and TCC residual SunDu series exhibit an upward trend or “brightening.” In addition to the long-term dimming and brightening, the volcanic eruptions of El Chichon and Mount Pinatubo are clearly evident in the TCC residual SunDu record. The TCC and SunDu records over the IP are well correlated with sea level pressure (SLP), with above normal TCC and below normal SunDu corresponding to below normal SLP locally in all seasons. The TCC and SunDu related SLP changes over the IP in winter and spring are part of a larger‐scale north‐south dipole pattern that extends over the entire Euro‐Atlantic sector. Other more regional atmospheric circulation patterns, identified from rotated principal component analysis, are also linked to TCC and SunDu variations over the IP. Finally and perhaps surprisingly, the TCC residual SunDu series exhibits a statistically significant relationship with a regional atmospheric circulation pattern during spring, summer, and autumn.
EU carbon prices drop as US Senate bars airlines from curbs
European Union carbon-dioxide permits dropped to a five-day low as oil prices declined and the U.S. Senate passed a measure that would effectively shield the country’s airlines from the EU emissions limits.
EU permits for delivery in December fell as much as 2 percent, the biggest decline since Sept. 19, and traded at 7.34 euros ($9.51) a metric ton, down 1.6 percent, on the ICE Futures Europe exchange as of 8:40 a.m. in London.
The Senate bill, which passed on Sept. 22 and must be reconciled with similar legislation passed by the House last year, would bar U.S. airlines from participating in the EU emissions trading system, or the ETS. While Transportation Secretary Ray LaHood said the Obama administration has not taken a position on the bill, in June he said the government “strongly opposes” the EU plan.
The 27-nation EU decided in 2008 to include flights to and from European airports in the ETS from 2012. International airlines have to surrender EU or United Nations emission permits against this year’s emissions by April 2013. Banning U.S. airlines from complying with the ETS may mean that fewer airlines buy permits, creating an excess of supply.
Brent crude for November delivery lost 0.8 percent to $110.55 a barrel on ICE Futures Europe as concern that European debt-crisis talks will falter and threaten the economic recovery outweighed speculation tension in the Middle East will disrupt crude supplies.
Oil can affect carbon prices because it’s linked to economic output and to cleaner-burning natural gas costs in Europe.
United Nations credits for December fell 1.6 percent to 1.85 euros. The contract sank to a record low of 1.43 euros on Sept. 18.
SOURCE
***************************************
For more postings from me, see DISSECTING LEFTISM, TONGUE-TIED, EDUCATION WATCH INTERNATIONAL, POLITICAL CORRECTNESS WATCH, FOOD & HEALTH SKEPTIC, GUN WATCH, AUSTRALIAN POLITICS, IMMIGRATION WATCH INTERNATIONAL and EYE ON BRITAIN. My Home Pages are here or here or here. Email me (John Ray) here.
The graphics problem: Graphics hotlinked to this site sometimes have only a short life and if I host graphics with blogspot, the graphics sometimes get shrunk down to illegibility. From January 2011 on, therefore, I have posted a monthly copy of everything on this blog to a separate site where I can host text and graphics together -- which should make the graphics available even if they are no longer coming up on this site. See here and here
*****************************************


 Jim Hansen and his twin


No comments:
Post a Comment