
Solar expert pessimistic. Thinks severe cooling is getting underway
Will the next cycle be a Dalton Minimum repeat, or a start of a new Maunder Minimum?
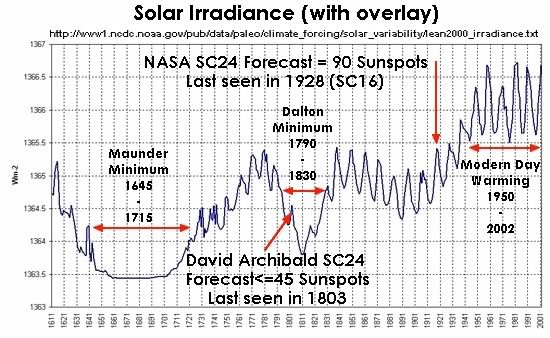
This is what David Archibald went on to say to SC25.Com in a recent email: He believes that start of Solar Cycle 24 could also be the start of a new Dalton or Maunder Minimum, the historic cooler conditions on Earth (see the period on display on the above overlay) that correlate to low solar activity and "Global Cooling".
He then said that the Maximum Sunspot count he expects is HALF of that forecast by NASA, in that David only expects no more then 45 Sunspots at the SC24 Maxima (last seen in 1803), and in his own words "it could even be south of that".
David also pointed out....."Solar Cycle 24 might not start until some time in 2010, and then be 15 years long. So Solar Cycle 25 might not start until 2025"......so is it bad news for the site name, no,.......we will keep you informed on the progress of Solar Cycle 24...if that Solar Cycle is bad news then SC25 could be a lot worse.....stay turned.
SOURCE
The exploding carbon tax
The costs imposed by the cap and trade system are equivalent to raising a family of four's income tax by 50 percent
by Martin Feldstein
The cap and trade legislation supported by the Obama administration is a stealth strategy for a massive long-term tax increase. It is a large tax on all American households, and the tax burden rises in future years without any need for further legislation. It will evolve into an enormous new source of tax revenue for the government.
A cap and trade system is supposed to reduce carbon dioxide (CO2) emissions by raising the price of CO2-intensive goods and services like gasoline, electricity, and a wide range of industrial products. This, in theory, will induce consumers to shift their spending to services and products that involve lower levels of CO2 emissions. It achieves these price increases by requiring firms that create CO2 in their production process, or sell goods like gasoline that create CO2 when used, to have a permit per ton of CO2 emission.
The Congressional Budget Office estimates that reducing the level of CO2 to 15 percent less than the total level of U.S. emissions in 2005 would require permit prices that would increase the cost of living of a typical household by $1,600 a year. To put that $1,600 carbon tax in perspective, a typical family of four with earnings of $50,000 now pays an income tax of about $3,000. The tax imposed by the cap and trade system is therefore equivalent to raising the family's income tax by about 50 percent. (Some advocates of a cap and trade program argue that the cost to households could be much less than $1,600 if the government uses the tax revenue to finance transfers to low income households and tax cuts to others, but since there is no way to know how the future revenue would actually be used, the only number we have to consider is the $1,600 direct increase in the burden on households.)
The Waxman-Markey bill that recently passed the House Energy and Commerce Committee would cause an even greater initial rise in the cost of living by its requirement to cut CO2 emissions to 17 percent less than the 2005 level of emissions rather than the 15 percent reduction assumed in the CBO estimates. (European officials are, moreover, calling for the United States to agree to a much bigger initial cut--20 percent less than the U.S. emission level in 1990.)
As the legislated CO2 reduction increases automatically after 2020, the price of the permits would rise to further limit consumers' demand for CO2-intensive goods and services. The Waxman-Markey legislation requires the CO2 level in 2050 to be an amazing 83 percent less than it was in 2005, and a study by the EPA estimates that the price of the permit would rise from about $20 a ton in 2020 to more than $75 a ton in 2050. The higher permit costs would be reflected in the prices that households would pay for CO2-intensive goods and services.
Rises in the cost of living would be greater for households that use more energy and CO2-intensive goods and services. The implied rate of the cap and trade carbon tax would therefore rise with income. In that way it would act like an income tax--reducing the reward for additional effort by putting a tax wedge between the individuals' additional work effort and the resulting increase in their standard of living. But while it would collect more tax from higher income households, the cap and trade tax would be a relatively heavier burden on lower-income and middle-income households. The Congressional Budget Office estimates that spending on "carbon based energy" is 21.4 percent of income among households in the lowest income quintile but only 4.1 percent of income in the highest income quintile.
More HERE
Trains more harmful for climate than planes
Assuming that CO2 emissions are harmful
A new study has suggested that greenhouse gas emissions generated by trains are much higher than those produced by an airplane. Unlike previous studies on transport emissions, this one looks beyond what is emitted by different types of car, train, bus or plane while their engines are running and includes emissions from building and maintaining the vehicles and their infrastructure, as well as generating the fuel to run them. Including these additional sources of pollution more than doubles the greenhouse gas emissions of train travel.
The emissions generated by car travel increase by nearly one third when manufacturing and infrastructure are taken into account. In comparison to cars on roads and trains on tracks, air travel requires little infrastructure. As a result, full life-cycle emissions are between 10 and 20 per cent higher than “tailpipe” emissions.
According to a report in New Scientist, Mikhail Chester and Arpad Horvath of the University of California, Berkeley, included in their calculations data on the “life expectancy” of each component of each mode of transportation, such as the tracks used by a train and the airports used by aircraft. They calculated the total “travel kilometers” each component allows and how many tonnes of greenhouse gases were emitted to build and maintain each component. This allowed them to calculate the component’s emissions per kilometre travelled, for each mode of transport per kilometre for each traveller on board.
Cars emitted more than any other form of transport with the notable exception of off-peak buses, which often carry few passengers. Passengers on the Boston light rail, an electric commuter train, were found to emit as much or marginally more than those on mid-size and large aircraft. This is because burning fossil fuels generates 82 per cent of electricity in Massachusetts.
More than half of the life-cycle emissions from rail come not from the engines’ exhausts, but infrastructure development, such as station building and track laying, and providing power to stations, lit parking lots and escalators. “Any government considering expanding its rail network should take into account the emissions it will generate in doing so,” Chester said. “New rail systems should serve as links to other transit modes, as is often the case in Europe and Japan,” he added. “We should avoid building rail systems that are disconnected from major population areas and require car trips and parking to access,” he explained.
SOURCE
Geologist points out major flaws in Obama's 'new scare report'
Below is a guest post by Geophysicist Dr. David Deming, associate professor of arts and sciences at the University of Oklahoma who has published numerous peer-reviewed research articles
1. The new scare report issued by the Obama administration refers to the work of Stephen H. Schneider six times. You will recall that Schneider is infamous for telling Discover magazine (October, 1989, p. 45-48) that "we have to offer up scary scenarios, make simplified, dramatic statements, and make little mention of any doubts we might have...each of us has to decide what the right balance is between being effective and being honest."
2. There has been no sea level rise for the past three years.
3. Hurricane, typhoon, and tropical cyclone activity is at a 30-year low.
4. The satellite data (UAH MSU) currently show that mean global temperature is about the same as it was in June of 1979 ...no, if anything, it is LOWER.
5. Mean global sea ice is at the 20-year mean level, and the same as it was in 1979 when monitoring began.
6. Global "warming" is based almost entirely on the record from meteorological stations. Anthony Watt's survey of 1221 weather stations is now 70 percent complete, and shows that an astonishing 69 percent of these stations are likely to have serious errors, due to their being located near heat sources such as asphalt paving, air conditioning vents, etc.
After following this subject now since the mid 1980s, I become more skeptical every year. I am now beginning to conclude that global warming simply does not exist.
SOURCE
Climate Sensitivity (CS), Negative Feedback (NF), and all that
(SEPP Science Editorial #17-2009 of 6/13/09)
Based on empirical evidence, various researchers have concluded that CS is much smaller than the model-derived values quoted by the IPCC. Some of the empirical studies compare observed temperature trends over time with IPCC values [Schwartz, Monckton, etc]; others [Douglass, Singer, NIPCC] compare observed and modeled patterns of temperature trends (“fingerprints”)’
CS is conventionally defined as the equilibrium temp rise caused by a doubled forcing of GH gases; it is often taken to be just a doubling of CO2 levels. The ‘canonical’ CS values of the IPCC range from 1.5 to 4.5 C, with a median of 3.0 C. Many model calculations show higher values, depending on assumptions about cloud parameters; for example, Stainforth et al [2005] quote as high as 11.5 C.
The empirical values for CS are all well below the IPCC’s; some are 0.5 C or even less, corresponding to a trend of Global Mean Sfc Temp (GMST) of only about 0.05 C/decade and a tropical troposphere trend of about 0.1 C/decade. These trends are at or below the limit of detection, because of the interfering effects of aerosol emissions (both natural and anthropogenic), volcanic eruptions, El Niños and other, less dramatic atmosphere-ocean interactions.
The ‘fingerprint’ method can only conclude that anthropogenic effects are not detected [NIPCC], and yields no values for CS – only an upper limit of perhaps 0.3 C, an order of magnitude smaller than the IPCC’s median value.
How to account for the huge discrepancy between IPCC and NIPCC? In principle, one can invoke natural forcings, both external (solar) and internal, as well as aerosols that affect the optical properties of the atmosphere. It is tempting, however, to first investigate the possibility of negative feedbacks within the climate system itself, principally the various effects of water in the atmosphere.
Atmospheric water can occur in three different forms: as a gas -- water vapor (WV), as liquid cloud droplets, and as solid ice particles. In principle, one can measure the climate effects of each component, as we shall discuss below.
1. Liquid: The negative feedback effects of water droplets are easiest to visualize [Singer WSJ 1988]. As the oceans warm, increased evaporation can increase cloudiness, increasing optical albedo, and reducing the incidence of solar radiation at the surface – thus reducing any warming caused by increasing GH gases. But measuring such an albedo change is difficult, requiring accuracies of a fraction of a percent and exceptional stability over a number of years.
2. WV: Models all assume a constant relative humidity with altitude; thus WV in the cold upper troposphere (UT) will radiate at a low temperature and contribute little to OLR (outgoing long-wave radiation), with the remainder therefore coming from the warm surface. (Total OLR is fixed and must equal absorbed solar energy.) However, if atmospheric processes manage to achieve a drying of the UT (as GH gases increase) [Ellsaesser, Gray, Lindzen], then WV will radiate at the higher temperature of the boundary layer, contribute the bulk of the OLR, and leave less IR emission from the surface.
Satellite measurements, such as by the AIRS instrument, can resolve the WV bands in the OLR and determine the source temperature. Data would be required versus latitude, and over a number of years.
3. Ice: Convective activity in the tropics can transport moisture to heights near the tropopause where ice crystals would form cirrus clouds, often invisible but having strong absorption properties over the entire effective IR region. A reduction of the area covered by cirrus (“iris effect” – Lindzen) would permit more escape of IR from the surface and thus produce a cooling -- a negative feedback.
Again, AIRS data could obtain the necessary confirming data by observing long-term trends.
NF is not a sure thing; aerosols and/or natural forcings can reduce and even overcome GH warming. At present, one cannot tell which of the possible NF effects is dominant; but the right kind of data could help settle the issue. Establishing the magnitude of NF would independently confirm the low values of CS.
SOURCE
As Wind Power Grows, a Push to Tear Down Dams
This is Greenie destructiveness at its craziest. Tear down a reliable power source and replace it by a highly intermittent one?? That will mean NO power at all for parts of most days
For decades, most of the nation’s renewable power has come from dams, which supplied cheap electricity without requiring fossil fuels. But the federal agencies running the dams often compiled woeful track records on other environmental issues.
Now, with the focus in Washington on clean power, some dam agencies are starting to go green, embracing wind power and energy conservation. The most aggressive is the Bonneville Power Administration, whose power lines carry much of the electricity in the Pacific Northwest. The agency also provides a third of the region’s power supply, drawn mostly from generators inside big dams.
The amount of wind power on the Bonneville transmission system quadrupled in the last three years and is expected to double again in another two. The turbines are making an electricity system with low carbon emissions even greener — already, in Seattle, more than 90 percent of the power comes from renewable sources.
Yet the shift of emphasis at the dam agencies is proving far from simple. It could end up pitting one environmental goal against another, a tension that is emerging in renewable-power projects across the country.
Environmental groups contend that the Bonneville Power Administration’s shift to wind turbines buttresses their case for tearing down dams in the agency’s territory, particularly four along the lower Snake River in Washington State that helped decimate one of North America’s great runs of wild salmon.
Bonneville wants to keep all the dams, arguing that they not only provide cheap power but they also make an ideal complement to large-scale installation of wind power. When the wind slows and power production drops, the agency argues, it can compensate quickly by telling the Army Corps of Engineers and the Bureau of Reclamation, which operate the dams, to release more water from reservoirs to turn the huge generators. When the wind picks up, dam operations can be slowed.
The dams help alleviate a need for natural-gas-fired power plants, which are used in other regions as a backup power source when the wind stops blowing, but which release carbon dioxide that contributes to global warming.
By balancing wind power with hydropower, the Bonneville Power Administration says it believes it can limit the use of natural gas and coal plants across the West, even as the region’s demand for electricity rises. Around the country, dams provide 6 percent of electricity generation — double the amount from other renewable sources like wind, solar power and biomass — and much of that is concentrated in the West.
The influx of wind on Bonneville’s system has come as a result of renewable power goals set by governments in the Western states, which aim to reduce their output of greenhouse gases. Bonneville says that when the wind is blowing most strongly, 18 percent of the power in its control area now comes from wind, and that number may rise to 30 percent next year. (Not all of that is consumed in the Pacific Northwest; some is sold to California.)
The rise in wind power means that the dam agency has emerged as a national test case for how to integrate large amounts of intermittent wind power into a regional electric grid. “I’ve described this as a grand experiment,” said Stephen J. Wright, the administrator of the 72-year-old Bonneville Power Administration.
The agency stresses the challenge it faces, making sure the lights stay on despite the ups and downs of the wind. Many new wind farms lie along the gusty Columbia River corridor, and their concentration means that changes in the wind can bring sudden dips and spikes in the power they generate. “We can have periods that go from full, maximum wind output to zero across an hour,” Mr. Wright said.
Because of its erratic nature, wind power — and the need for dams or other backup systems — has become intertwined with the fate of salmon, perhaps the biggest environmental controversy in the Pacific Northwest.
For decades, environmentalists, fishermen and some local politicians, who want to save the endangered salmon, have fought Bonneville and the Army Corps of Engineers, which want to keep the lower Snake River dams. A federal judge overseeing the dispute has accused the federal agencies of not working hard enough to save the salmon and had raised the possibility of breaching those dams to aid the fish.
Wild salmon ride the river in two directions. They spawn far upstream, and the young fish swim downriver to the Pacific Ocean. They spend several years there, feeding and growing quite large, before swimming back upstream to spawn and die.
The large reservoirs created over the decades as the dams were built have slowed and complicated their journeys, and slashed survival rates. Fish ladders help on the way back upstream, but those salmon that get through in both directions end up traumatized and weakened, biologists say.
When it comes to helping salmon, Bonneville has “been dragged kicking and screaming every inch of the way,” said Bill Arthur, a Sierra Club representative in the Northwest. Mr. Arthur praised the agency’s efforts to add wind power, but he argued that the four lower Snake River dams, which are far smaller than major dams like Grand Coulee, were not needed to back up wind power.
More HERE
***************************************
For more postings from me, see DISSECTING LEFTISM, TONGUE-TIED, EDUCATION WATCH INTERNATIONAL, POLITICAL CORRECTNESS WATCH, FOOD & HEALTH SKEPTIC, GUN WATCH, SOCIALIZED MEDICINE, AUSTRALIAN POLITICS, IMMIGRATION WATCH INTERNATIONAL and EYE ON BRITAIN. My Home Pages are here or here or here. Email me (John Ray) here. For readers in China or for times when blogger.com is playing up, there is a mirror of this site here.
*****************************************


 Jim Hansen and his twin


No comments:
Post a Comment