
Considering that climate models are predicting global temperatures to be rising at a rate far greater than they actually are, you would think that the model developers would be taking a long, hard look at their models to try to figure out why they are on the verge of failing.
In fact, I would expect to soon start to see papers in the scientific literature from various modeling groups attempting to explain why their models have gone awry and to provide an accompanying downward revision of their projections of 21st century temperature change. After all, how long a period of no warming can be tolerated before the forecasts of the total warming by century’s end have to be lowered? We’re already into our ninth year of the 100 year forecast period and we have no global warming to speak of.
So imagine my surprise when a paper just appeared in the Journal of Climate by a group of researchers at M.I.T. that nearly doubled the existing expectations of the total warming by the year 2100!
This is quite a gutsy group, for not only are they saying that the prevailing model projections—which are already way too hot—are warming things up too slowly, but that when they re-examine the model inputs, they predict a best-guess warm-up that lies very near the current worse-case projections. The research group led by Andrei Sokolov and Ronald Prinn expects that the most likely warming by the year 2100 to be 5.2ºC with a 90% confidence range bounded by 3.5ºC on the low side and 7.4ºC on the high side. Like I said, gutsy.
Just to put that in perspective, I present Figure 2 which shows generally what the temperature rise during the next 90 years, 7 months needs to look like for that prediction to be true.
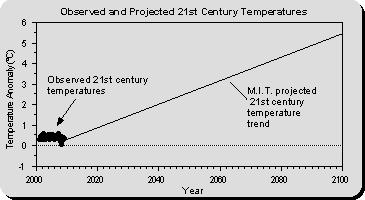
Figure 2. Observed and projected 21st century temperatures and trends.
This is utterly incredible and virtually impossible. As a picture is valued at about thousand words, I probably couldn’t come up with a thousand more choice ones than Figure 2 is worth. So I’ll leave it at that.
If you are interested in analysis by someone who is able to conjure up a few words to describe the more blatant problems with the M.I.T. study, Roy Spencer is happy to provide one. He starts out:
Climate science took another step backward last week as a new study from the Massachusetts Institute of Technology was announced which claims global warming by 2100 will probably be twice as bad as the United Nations Intergovernmental Panel on Climate Change (IPCC) has predicted.
He goes on from there to describe what is wrong with the study—foremost in Dr. Spencer’s mind being the overly high climate sensitivity term:
But as I have mentioned before, the use of statistical probabilities in this context is inappropriate. There is a certain climate sensitivity that exists in the real climate system, and it is true that we do not know exactly what that sensitivity is. But this does not mean that our uncertainty over its sensitivity can be translated into some sort of statistical probability.
The use of statistical probabilities by the IPCC and the MIT group does two misleading things: (1) it implies scientific precision where none exists, and (2) it implies the climate system’s response to any change is a “roll of the dice”.
We know what the probability of rolling a pair of sixes with dice is, since it is a random event which, when repeated a sufficient number of times, will reveal that probability (1 in 36). But in contrast to this simple example, there is instead a particular climate sensitivity that exists out there in the real climate system. The endless fascination with playing computer games to figure out that climate sensitivity, in my opinion, ends up wasting a lot of time and money.
True, there are many scientists who really do think our tinkering with the climate system through our greenhouse gas emissions is like playing Russian roulette. But the climate system tinkers with itself all the time, and the climate has managed to remain stable. There are indeed internal, chaotic fluctuations in the climate system that might appear to be random, but their effect on the whole climate system are constrained to operate within a certain range. If the climate system really was that sensitive, it would have forced itself into oblivion long ago.
To read more of Dr Spencer’s analysis, check out his article “The Global Warming Climate Gamble.”
Ultimately, he arrives at a similar conclusion as do I: [I]t is only a matter of time before the climate community placing all its bets on the climate models is revealed to be a very bad gamble.
Update: Several commentors have asked to see a longer-term history of observations against which to compare the M.I.T. 21st century projections.
Since the projections only cover the period from 2001 to 2100, I originally only showed the observations that thus far have occurred during that period (Figure 2). But for those want to see a longer perspective, I introduce Figure 3, the observed temperatures since 1900 along with the M.I.T. 21st century projections. To me, this doesn’t makes the projection look any better, but you can judge for yourself.
Figure 3. Observed temperatures from 1900 through 2008 along with the 21st century projections from M.I.T.
SOURCE
A Layman’s Explanation of Why Global Warming Predictions by Climate Models are Wrong
Written by Dr. Roy W. Spencer
I occasionally hear the complaint that some of what I write is too technical to understand, which I’m sure is true. The climate system is complex, and discussing the scientific issues associated with global warming (aka “climate change”) can get pretty technical pretty fast.
Fortunately, the most serious problem the climate models have (in my view) is one which is easily understood by the public. So, I’m going to make yet another attempt at explaining why the computerized climate models tracked by the U.N.’s Intergovernmental Panel on Climate Change (IPCC) – all 23 of them – predict too much warming for our future. The basic problem has been peer reviewed and published by us, and so cannot be dismissed lightly.
But this time I will use no graphs (!), and I will use only a single number (!!) which I promise will be a small one.
I will do this in three steps. First, I will use the example of a pot of water on the stove to demonstrate why the temperature of things (like the Earth) rises or falls.
Secondly, I will describe why so many climate model “experts” believe that adding CO2 to the atmosphere will cause the climate system to warm by a large, possibly catastrophic amount.
Finally, I will show how Mother Nature has fooled those climate experts into programming climate models to behave incorrectly.
Some of this material can be found scattered through other web pages of mine, but here I have tried to create a logical progression of the most important concepts, and minimized the technical details. It might be edited over time as questions arise and I find better ways of phrasing things.
The Earth’s Climate System Compared to a Pot of Water on the Stove
Before we discuss the average temperature of the Earth, let’s start with the simple example of a pot of water placed on a stove. Imagine it’s a gas stove, and the flame is set on its lowest setting, so the water will become warm but will not boil. To begin with, the pot does not have a lid.
Obviously, the heat from the flame will warm the water and the pot, but after about 10 minutes the temperature will stop rising. The pot stops warming when it reaches a point of equilibrium where the rate of heat loss by the pot to its cooler surroundings equals the rate of heat gained from the stove. The pot warmed as long as an imbalance in those two flows of energy existed, but once the magnitude of heat loss from the hot pot reached the same magnitude as the heat gain from the stove, the temperature stopped changing.
Now let’s imagine we turn the flame up slightly. This will result in a temporary imbalance once again between the rate of energy gain and energy loss, which will then cause the pot to warm still further. As the pot warms, it loses energy even more rapidly to its surroundings. Finally, a new, higher temperature is reached where the rate of energy loss and energy gain are once again in balance.
But there’s another way to cause the pot to warm other than to add more heat: We can reduce its ability to cool. If next we place a lid on the pot, the pot will warm still more because the rate of heat loss is then reduced below the rate of heat gain from the stove. In this case, loosely speaking, the increased temperature of the pot is not because more heat is added, but because less heat is being allowed to escape.
This example is the same fundamental situation that exists with climate change in general, and global warming theory in particular. A change in the energy flows in or out of the climate system will, in general, cause a temperature change. The average temperature of the climate system (atmosphere, ocean, and land) will remain about the same only as long as the rate of energy gain from sunlight equals the rate of heat loss by infrared radiation to outer space.
Again, the average temperature of the Earth (like a pot of water on the stove) will only change when there is an imbalance between the rates of energy gained and energy lost.
Global Warming
What this means is that anything that can change the rates of energy flow — in or out of the climate system — can cause global warming or global cooling. For instance, if the amount of cloud cover reflecting sunlight back to space decreases from, say, a change in weather patterns, then more sunlight will be absorbed by the land and ocean. As a result, there will then be an imbalance between the infrared energy lost and solar energy gained by the Earth. The Earth will warm until the amount of infrared energy loss to space (which goes up with temperature, like the heat loss by the pot went up with temperature) once again equals the amount of energy gained by the sun.
But just as in the case of the pot of water, we can also cause global warming by reducing the rate at which the Earth loses energy. For instance, the so-called greenhouse effect of the atmosphere, due mostly to water vapor, clouds, carbon dioxide and methane, acts like a radiative blanket, warming the lower atmosphere and the surface. In the theory of manmade global warming, increasing carbon dioxide concentrations in the atmosphere (presumably due to burning of fossil fuels) slightly enhances the Earth’s natural greenhouse effect. An energy imbalance results because the rate of cooling of the Earth is then reduced slightly — somewhat like putting the lid on the pot of warm water — and as a result the Earth is expected to warm until equilibrium is once again restored.
Now for a magic number that we will be referring to later, which is how much more energy is lost to outer space as the Earth warms. It can be calculated theoretically that for every 1 deg C the Earth warms, it gives off an average of about 3.3 Watts per square meter more infrared energy to space. Just as you feel more infrared (heat) radiation coming from a hot stove than from a warm stove, the Earth gives off more infrared energy to space the warmer it gets.
The $64 Trillion Question: By How Much Will the Earth Warm?
This 3.3 Watts per sq. meter represents how much extra energy the Earth loses if ONLY the temperature is increased, and nothing else is changed. In the real world, however, we can expect that the rest of the climate system will NOT remain the same in response to a warming tendency.
In fact, the most important scientific debate in global warming theory is not over what I have just described, which virtually all climate scientists will agree with. The main debate is instead over how clouds (and to a lesser extent other elements in the climate system) respond to that warming, thereby enhancing or reducing the warming. These indirect changes that further influence temperature are called feedbacks, and they determine whether manmade global warming will be catastrophic, or just lost in the noise of natural climate variability.
Returning to our example of the whole Earth warming by 1 deg. C, if that warming causes an increase in cloud cover, then the 3.3 Watts of extra infrared loss to outer space gets augmented by a reduction in solar heating of the Earth by the sun. The result is a smaller temperature rise. This is called negative feedback, and if it exists in the real climate system, then manmade global warming will become, for most practical purposes, a non-issue.
But if the cloud cover of the Earth decreases with warming, then more sunlight will be let in and the Earth will warm to an even higher temperature. The same is true if the water vapor content of the atmosphere increases with warming. These are called positive feedbacks, and all 23 climate models tracked by the IPCC now exhibit positive cloud and water vapor feedback. The main difference between models that predict moderate warming versus those that predict strong warming has been traced to the strength of their positive cloud feedbacks.
Obviously, the question of how clouds in the REAL climate system respond to a warming tendency is of paramount importance, because that guides the development and testing of the climate models. Ultimately, the models must be based upon the observed behavior of the atmosphere.
So, what IS observed when the Earth warms? Do clouds increase or decrease? While the results vary with which years are analyzed, it has often been found that warmer years have less cloud cover, not more.
And this has led to the conclusion that cloud feedbacks in the real climate system are probably positive, although by an uncertain amount. The interpretation goes like this: Warming causes a decrease in clouds which then causes still more warming. That’s positive cloud feedback. And if cloud feedbacks end up being too strongly positive, then we are in big trouble from manmade global warming.
How Mother Nature Fooled the World’s Top Climate Scientists
At this point an important question needs to be asked that no one asks: What caused the initial warming? By definition, cloud feedback can not occur unless the temperature changes…but what if that temperature change was caused by clouds in the first place?
This is important because if decreasing cloud cover caused warming, and this has been mistakenly interpreted as warming causing a decrease in cloud cover, then positive feedback will have been inferred even if the true feedback in the climate system is negative.
As far as I know, this potential mix-up between cause and effect — and the resulting positive bias in diagnosed feedbacks — had never been studied until we demonstrated it in a peer-reviewed paper in the Journal of Climate. Unfortunately, because climate research covers such a wide range of specialties, most climate experts are probably not even aware that our paper exists.
So how do we get around this cause-versus-effect problem? Our very latest research, now in peer review for possible publication in the Journal of Geophysical Research, shows that one can separate, at least partially, the effects of clouds-causing-temperature-change (which “looks like” positive feedback) versus temperature-causing-clouds to change (true feedback).
We analyzed 7.5 years of our latest and best NASA satellite data and discovered that, when the effect of clouds-causing-temperature-change is accounted for, cloud feedbacks in the real climate system are strongly negative. The negative feedback was so strong that it more than cancelled out the positive water vapor feedback we also found. It was also consistent with evidence of negative feedback we found in the tropics and published in 2007.
In fact, the resulting net negative feedback was so strong that, if it exists on the long time scales associated with global warming, it would result in only 0.6 deg. C of warming by late in this century.
Natural Cloud Variations: The Missing Piece of the Puzzle?
In this critical issue of cloud feedbacks – one which even the IPCC has admitted is their largest source of uncertainty — it is clear that the effect of natural cloud variations on temperature has been ignored. In simplest of terms, cause and effect have been mixed up. (Even the modelers will have to concede that clouds-causing-temperature change exists because we found clear evidence of it in every one of the IPCC climate models we studied.)
But this brings up another important question: What if global warming itself has been caused by a small, long-term, natural change in global cloud cover? Our observations of global cloud cover have not been long enough or accurate enough to document whether any such cloud changes have happened or not. Some indirect evidence that this has indeed happened is discussed here.
Even though they never say so, the IPCC has simply assumed that the average cloud cover of the Earth does not change, century after century. This is a totally arbitrary assumption, and given the chaotic variations that the ocean and atmosphere circulations are capable of, it is probably wrong. Little more than a 1% change in cloud cover up or down, and sustained over many decades, could cause events such as the Medieval Warm Period or the Little Ice Age.
As far as I know, the IPCC has never discussed their assumption that global average cloud cover always stays the same. The climate change issue is so complex that most experts have probably not even thought about it. But we meteorologists by training have a gut feeling that things like this do indeed happen. In my experience, a majority of meteorologists do not believe that mankind is mostly to blame for global warming. Meteorologists appreciate how complex cloud behavior is, and most tend to believe that climate change is largely natural.
And this cause-versus-effect issue is not limited to just clouds. For instance, there are processes that can cause the water vapor content of the atmosphere to change, mainly complex precipitation processes, which will then change global temperatures. This has long been known, but again, climate change research covers such a wide range of disciplines that very few of the experts have recognized the importance of obscure studies that have been published.
While there are a number of other potentially serious problems with climate model predictions, this issue alone has the power to mostly deflate all predictions of substantial global warming. It is only a matter of time before others in the climate research community realize this, too.
SOURCE (See the original for links, graphics etc.)
Airborne Bacteria Discredit Climate Modeling Dogma
Clouds are a major weak point in Warmist models. Changing the assumptions greatly changes the results
The formation of low-level clouds—clouds that have a cooling effect on Earth's climate—has vexed climate scientists for years. Current climate models treat cloud cover simplistically and make the assumption that cloud cover decreases as temperatures rise. New data from a cloud sampling experiment indicates that biological material—bacteria, spores and plant material—may account for 1/3 of the airborne material involved in cloud formation. Furthermore, biological material can form clouds at much warmer temperatures than mineral dust. These new discoveries indicate that modelers have the effects of temperature on low cloud cover backwards, placing all model predictions in doubt.
A team led by Kim Prather, of Scripps Institution of Oceanography and the University of California San Diego, used an aircraft with a specially designed lab instrument called a mass spectrometer to identify the particles that ice crystals and water droplets form around. Ice crystals, sampled from clouds and quickly analyzed while in flight, showed bits of biological material along with other aerosols. “The key to cloud formation is these little seeds that feed the clouds,” Prather said in an interview. “We are basically trying to understand what is forming clouds.”
Aerosols, including dust, soot, salt from ocean spray and organic materials, form the seeds clouds grow from. Around these tiny particles, water and ice in the atmosphere condense and grow, a process called nucleation. Scientists are trying to understand how clouds form, because clouds play a critical role by both cooling the atmosphere and affecting regional precipitation.
“By sampling clouds in real time from an aircraft, these investigators were able to get information about ice particles in clouds at an unprecedented level of detail,” Anne-Marie Schmoltner, of the National Science Foundation's Division of Atmospheric sciences, said in a statement. “By determining the chemical composition of the very cores of individual ice particles, they discovered that both mineral dust and, surprisingly, biological particles play a major role in the formation of clouds.”
Sampling clouds above Wyoming, the researchers found that biological matter accounted for 33% of the particles in ice crystals, and mineral dust accounted for 50%, some of it from as far away as Asia. The findings suggest biological particles that get swept up in dust storms help induce cloud formation. While it has long been known that microorganisms or parts of them get airborne and travel great distances, this study, reported in Nature Geoscience online, is the first to measure their participation in cloud ice formation.
In climate change science, which derives many of its projections from computer simulations of climate phenomena, the actions of aerosols on clouds represent what scientists consider the greatest uncertainty in modeling predictions for the future. Because General Circulation Models (GCM) use a very coarse grid—on the order of 100 km square—the effect of cloud formation processes cannot be accurately modeled, even if there were enough spare computer cycles to do so. Instead, simple average values for cloud cover effects are used to calculate the impact of clouds on temperature, and that is where the faulty assumptions have been applied.
According to Dr. Roy Spencer, meteorologist and former Senior Scientist for Climate Studies at NASA’s Marshall Space Flight Center, the warming in models is known to be mostly controlled by low and middle level clouds. He explains in a posting on his blog:
The main reason the models produce so much warming depends upon uncertain assumptions regarding how clouds will respond to warming. Low and middle-level clouds provide a ‘sun shade’ for the Earth, and the climate models predict that those clouds will dissipate with warming, thereby letting more sunlight in and making the warming worse.
The important participation of biological and mineral aerosols in cloud formation provides a viable explanation for increased, not decreased cloud formation as Earth heats up. As I reported in an earlier post, dust and material from North Africa seems to have a significant impact on the tropical Atlantic. In other places, climate change is also being blamed for increase in airborne particulates.
An obvious cause would be desertification, long touted to be an effect of global warming. But there are subtler linkages as well. Extended growing seasons, also being attributed to global warming, give plants more opportunity to contribute to airborne material. Drought, leading to more natural fires, would contribute carbon based aerosols while stressed plant populations could be more susceptible to bacterial infection, increasing the amount of airborne bacteria.
This implies a negative feedback loop: global warming increases aerosols, which increases low and medium level cloud cover, cooling the climate. To again quote from Dr. Spenser: “If feedbacks end up being negative... then extra CO2 will have caused even less warming, which means that there is even more room for natural cloud variability to explain the warming experienced in the last 50 to 100 years.”
This is not the first indication that bacteria may help regulate climate. Professor Brent Christner of Louisiana State University, with colleagues in Montana and France, reported evidence in the journal Science that “rain-making” bacteria are widely distributed in the atmosphere. “My colleague David Sands from Montana State University proposed the concept of 'bioprecipitation' over 25 years ago and few scientists took it seriously, but evidence is beginning to accumulate that supports this idea,” said Christner.
There has been speculation that biological particles could factor heavily into the precipitation cycle, affecting climate, agricultural productivity and even global warming for some time now. This is because it is well established that biological particles can promote nucleation and at higher temperatures than particles of mineral dust. Many ski resorts use a commercially available freeze-dried preparation of ice-nucleating bacteria to make snow when the temperature is just a few degrees below freezing.
“The role that biological particles play in atmospheric processes has been largely overlooked. However, we have found biological ice nuclei in precipitation samples from Antarctica to Louisiana - they're ubiquitous. Our results provide an impetus for atmospheric scientists to start thinking about the role these particles play in precipitation,” said Christner. Non-biological particles are good at collecting water at temperatures below about 14°F (-10°C), biological particles seem to be the main active nuclei above that temperature, according to Christner's findings. Unfortunately, this knowledge isn't incorporated into climate models.
“Our results provide an impetus for atmospheric scientists to start thinking about the role these particles play in precipitation,” says Prof Christner. “It clearly demonstrates that we are just beginning to understand the intricate interplay between the planet's climate and biosphere.”
Even prior to the discovery of the bacteria climate link, aerosols' role in cloud formation had been inadequately portrayed in climate models. Joyce E. Penner, a leading atmospheric scientist at the University of Michigan, presented a talk on the topic “Aerosol-Cloud Interactions and Climate Projections,” during a panel at a meeting of the American Association for the Advancement of Science in San Francisco on Feb. 17, 2007. Using known temperature data starting in 1850, two different climate models were compared. One had low climate sensitivity and small amounts of aerosols and the other high climate sensitivity and high amounts of aerosols. Penner's group showed that both models follow almost identical predictive paths in the past, but diverge significantly when predicting the temperature in the future.
Further, Penner's presentation discussed the predictive capability of three other climate models: the US NCAR-Oslo model, a French model and a Japanese model. Tests showed that large differences and significant changes in results occurred, especially when having the models predict both aerosols and their cloud effects using assumed historical aerosol levels. It is no secret to savvy climate modelers that their models are not capable of accurately predicting future climate change. “We know that aerosol effects on clouds need to be included in climate models,” Penner said.
These are just the latest revelations about the shaky foundation climate models are built on. Missing factors and erroneous feedback loops highlight how arbitrary decisions, which happen to reinforce the modeler's desired result, can undermine a model's veracity. Nobody denies that atmospheric CO2 increases environmental heating. The problem is that, relative to other forcings, this is a small effect that is quickly overwhelmed by other factors. A slight change in cloud cover can completely nullify any effect of CO2, and we have no way of accurately predicting cloud cover—certainly not with the models currently available.
Answers to fill the gaps in our spotty knowledge can only be found in one place—Earth's physical environment. Still the allure of computer models keeps climate scientists gazing at display screens instead of the real world. Dr. Prather, Dr. Christner and their respective teams are to be commended for taking what is becoming a radical step in climate science—actually performing experiments and observing nature.
SOURCE
Global cooling is killing trees
A large number of eastern red cedar trees in south central Nebraska died this spring, probably from very cold temperatures in March. The dead trees mostly are in windbreaks in an area from southwest of Hastings to north of Columbus and are mostly younger trees under about 10 feet tall.
A Nebraska Forest Service forest health expert and UNL Extension officials examined many of the trees earlier this month. They believe a sudden freeze in early spring is the likely cause of the problem. “We’ve seen some long windbreaks where as many as two-thirds of the cedars died over the winter,” said Mark Harrell, Nebraska Forest Service forest health program leader. “When something like this happens over the winter to a large number of trees, it’s almost always caused by a sudden, large drop in temperature.”
Harrell said other factors, such as stress from the recent drought combined with root damage from disease-causing fungi in the soil, have been killing smaller groups of trees at some locations, but a freeze injury is the most likely cause where large numbers of trees are affected at this time of year over a wide area.
“We saw no evidence of any significant disease or insect problem on the foliage or anything that could be controlled with a pesticide treatment, so there’s no reason to spray the trees to try to control anything,” Harrell said.
It would be good to wait a few weeks to see if some of the brown trees grow out new foliage, Harrell suggested, because it is possible that the freeze killed only the foliage, and the branches may grow new foliage if given enough time.
SOURCE
The ocean acidification scare again
Odd that corals have survived in the geological past when CO2 levels were much higher than now
CLIMATE change is turning the oceans more acid in a trend that could endanger everything from clams to coral and be irreversible for thousands of years.
Seventy academies from around the world urged governments meeting in Bonn for climate talks from June 1-12 to take more account of risks to the oceans in a new UN treaty for fighting global warming due to be agreed in Copenhagen in December.
The academies said rising amounts of carbon dioxide, the main greenhouse gas emitted mainly by human use of fossil fuels, were being absorbed by the oceans and making it harder for creatures to build protective body parts. The shift disrupts ocean chemistry and attacks the "building blocks needed by many marine organisms, such as corals and shellfish, to produce their skeletons, shells and other hard structures", they said. On some projections, levels of acidification in 80 per cent of Arctic seas would be corrosive to clams that are vital to the food web by 2060, it said. And "coral reefs may be dissolving globally" if atmospheric levels of carbon dioxide were to rise to 550 parts per million (ppm) from a current 387 ppm.
Corals are home to many species of fish.
"These changes in ocean chemistry are irreversible for many thousands of years and the biological consequences could last much longer," they said. Martin Rees [a well-known and dedicated alarmist], president of the Royal Society, the British science academy, said there may be an "underwater catastrophe". "The effects will be seen worldwide, threatening food security, reducing coastal protection and damaging the local economies that may be least able to tolerate it," he said.
The academies said that if current rates of carbon emissions continue until 2050, computer models indicate "the oceans will be more acidic than they have been for tens of millions of years".
SOURCE
Australian Warmist laws to hit farmers
EMISSIONS trading could rip away as much as 22 per cent of farmers' income, government researchers say. That translates to up to $11,000 in income lost each year for an average-sized farm, with sheep and beef producers to be hardest hit. An Australian Bureau of Agricultural and Resource Economics report, issued today, paints an alarming picture of the cost of emissions trading for rural communities.
The Government is set to introduce an emissions trading scheme in 2011, with agriculture partially exempt until at least 2015.
In the worst case scenario - where agricultural processors don't put up their prices, instead passing all the higher costs on to farmers - beef farmers would lose 22 per cent of their income in 2015. Sheep farmers would also fare badly, losing 17 per cent of income. Broadacre industries and dairy farmers are next in line, losing between 11 and 15 per cent of their income.
Cows and sheep emit plenty of methane, a noxious greenhouse gas, which partly explains why the costs are high.
However, the economic impact is considerably less if processors don't pass through all the costs of the ETS on to farmers.
The research is based on operators continuing with their current farming practices, instead of trying to reduce greenhouse gas emissions and costs under the ETS. The ABARE report said the ETS would cost farmers through higher prices for electricity, fuels and freight.
Direct emissions - such as methane burped by cows - will not be covered until 2015, and it's expected that some farmers will get most of those emissions permits for free.
ABARE executive director Phillip Glyde, who released the report, said the ETS was not all bad news for farmers. "In combination with a global response to climate change, (it) will reduce the expected negative effects of climate change on agricultural productivity in Australia,'' Mr Glyde said.
SOURCE
***************************************
For more postings from me, see DISSECTING LEFTISM, TONGUE-TIED, EDUCATION WATCH INTERNATIONAL, POLITICAL CORRECTNESS WATCH, FOOD & HEALTH SKEPTIC, GUN WATCH, SOCIALIZED MEDICINE, AUSTRALIAN POLITICS, IMMIGRATION WATCH INTERNATIONAL and EYE ON BRITAIN. My Home Pages are here or here or here. Email me (John Ray) here. For readers in China or for times when blogger.com is playing up, there is a mirror of this site here.
*****************************************


 Jim Hansen and his twin


No comments:
Post a Comment