
Air pollution 'ages your lungs by TWO YEARS and increases risk of deadly disease' mass study finds
This is an unusually strong study in that it controlled for income. So the magnitude of the effects that they found is of interest. And the magnitudes were in all cases marginal -- close to 1.0 ORs -- so are not a suitable basis for any policy action. I append the journal abstract
Air pollution ages our lungs up to two years and increase our risk of a deadly lung disease, research suggests.
A study found exposure to pollutants in exhaust fumes and factory emissions is fuelling a rise in chronic obstructive pulmonary disease (COPD).
COPD is an incurable condition that occurs when the lungs become inflamed, damaged and narrowed. Over time, patients can develop breathlessness, suffer frequent chest infections and even cough up blood.
The research was carried out by Leicester University and led by Professor Anna Hansell, of the UK Centre for Environmental Health and Sustainability.
'In one of the largest analyses to date we found outdoor air pollution exposure is directly linked to lower lung function and increased COPD prevalence,' Professor Hansell said. 'We found people exposed to higher levels of pollutants had lower lung function equivalent to at least a year of ageing.
COPD describes a number of lung conditions. These include emphysema, which affects the air sacs, and chronic bronchitis, which impacts the airways.
Around 1.2million people in the UK are diagnosed with COPD, British Lung Foundation statistics show. This makes it the second most common lung disease after asthma.
And in the US, 16million people suffer from COPD, according to the Centers for Disease Control and Prevention.
'There are surprisingly few studies that look at how air pollution affects lung health,' Professor Hansell said. 'To try and address this, we assessed more than 300,000 people using data from the UK Biobank study to examine whether air pollution exposure was linked to changes in lung function.
The researchers analysed a range of pollutants including nitrogen dioxide (NO2), and tiny particles called PM10s and PM2.5s, which are released from vehicle exhausts and factory emissions.
These enter the lungs and bloodstream via the nose.
The researchers used a validated model to estimate the amount of air pollution the participants were exposed to at their homes when they signed up to the study between 2006 and 2010.
The participants, who were aged 40-to-69, also answered health questionnaires and had their lung function measured via a spirometry. This device measures how much air can be breathed out in one forced breath.
It has been suggested pollutants cut the average Briton's life by six months, while also limiting the growth of a child's lungs.
But the more recent study - published in the European Respiratory Journal - suggests air pollution may be far more damaging than previously feared.
Results revealed that for every annual average increase of five micrograms per cubic metre of PM2.5 in the air, the reduction in lung function is similar to two years of ageing. PM2.5 is around 20 times smaller than a grain of sand.
For those living in areas above the World Health Organization's (WHO) annual average guidelines of 10 micrograms of PM2.5 per cubic meter, COPD prevalence was four times higher than among people exposed to passive smoking at home. The EU air quality limit for PM2.5 is 25 micrograms per cubic meter.
Professor Tobias Welte, who is president of the European Respiratory Society, added: 'The findings of this large study reinforce that exposure to polluted air seriously harms human health by reducing life expectancy and making people more prone to developing chronic lung disease.
'Access to clean air is a fundamental need and right for all citizens in Europe. 'Governments have a responsibility to protect this right by ensuring maximum pollutant levels indicated by the WHO are not breached across our cities and towns.
'Breathing is the most basic human function required to sustain life, which is why we must continue to fight for the right to breathe clean air.'
Source
Air pollution, lung function and COPD: results from the population-based UK Biobank study
Dany Doiron et al.
Abstract
Ambient air pollution increases the risk of respiratory mortality but evidence for impacts on lung function and chronic obstructive pulmonary disease (COPD) is less well established. The aim was to evaluate whether ambient air pollution is associated with lung function and COPD, and explore potential vulnerability factors.
We used UK Biobank data on 3 03 887 individuals aged 40–69 years, with complete covariate data and valid lung function measures. Cross-sectional analyses examined associations of Land Use Regression-based estimates of particulate matter (PM2.5, PM10 and PMcoarse) and nitrogen dioxide (NO2) concentrations with forced expiratory volume in 1 s (FEV1), forced vital capacity (FVC), the FEV1/FVC ratio, and COPD (FEV1/FVC
Effect modification was investigated for sex, age, obesity, smoking status, household income, asthma status, and occupations previously linked to COPD.
Higher exposures to each pollutant were significantly associated with lower lung function. A 5 µg·m−3 increase in PM2.5 concentration was associated with lower FEV1 (−83.13 mL [95%CI: −92.50, −73.75]) and FVC (−62.62 mL [95%CI: −73.91, −51.32]). COPD prevalence was associated with higher concentrations of PM2.5 (OR 1.52 [95%CI: 1.42, 1.62], per 5 µg·m−3), PM10 (OR 1.08 [95%CI: 1.00, 1.16], per 5 µg·m−3), and NO2 (OR 1.12 [95%CI: 1.10, 1.14], per 10 µg·m−3), but not with PMcoarse. Stronger lung function associations were seen for males, individuals from lower income households, and “at-risk” occupations, and higher COPD associations for obese, lower income, and non-asthmatic participants.
Ambient air pollution was associated with lower lung function and increased COPD prevalence in this large study.
European Respiratory Journal 2019; DOI: 10.1183/13993003.02140-2018
The greening of the earth means more food for animals and greater crop yields for humans
Amid all the talk of an imminent planetary catastrophe caused by emissions of carbon dioxide, another fact is often ignored: global greening is happening faster than climate change. The amount of vegetation growing on the earth has been increasing every year for at least 30 years. The evidence comes from the growth rate of plants and from satellite data.
In 2016 a paper was published by 32 authors from 24 institutions in eight countries that analysed satellite data and concluded that there had been a roughly 14% increase in green vegetation over 30 years. The study attributed 70% of this increase to the extra carbon dioxide in the atmosphere. The lead author on the study, Zaichun Zhu of Beijing University, says this is equivalent to adding a new continent of green vegetation twice the size of the mainland United States.
Global greening has affected all ecosystems – from arctic tundra to coral reefs to plankton to tropical rain forests – but shows up most strongly in arid places like the Sahel region of Africa, where desertification has largely now reversed. This is because plants lose less water in the process of absorbing carbon dioxide if the concentration of carbon dioxide is higher. Ecosystems and farms will be less water-stressed at the end of this century than they are today during periods of low rainfall.
There should have been no surprise about this news. Thousands of experiments have been conducted over many years in which levels of CO2 had been increased over crops or wild ecosystems and boosted their growth. The owners of commercial greenhouses usually pump CO2 into the air to speed up the growth of plants. CO2 is plant food.
This greening is good news. It means more food for insects and deer, for elephants and mice, for fish and whales. It means higher yields for farmers; indeed, the effect has probably added about $3 trillion to farm incomes over the last 30 years. So less land is needed to feed the human population and more can be spared for wildlife instead.
Yet this never gets mentioned. In their desperation to keep the fearmongering on track the activists who make a living off the climate change scare do their best to ignore this inconvenient truth. When they cannot avoid the subject, they say that greening is a temporary phenomenon that will reverse in the latter part of this century. The evidence for this claim comes from a few models fed with extreme assumptions, so it cannot be trusted.
This biological phenomenon can also help to explain the coming and going of ice ages. It has always been a puzzle that ice ages grow gradually colder for tens of thousands of years, then suddenly warmer again in the space of a few thousand years, at which point the huge ice caps of Eurasia and North America collapse and the world enters a warmer interlude, such as the one we have been enjoying for 10,000 years.
Attempts to explain this cyclical pattern have mostly failed so far. Carbon dioxide levels track the change, but these rise after the world starts to warm and fall after the world starts to cool, so they are not the cause. Changes in the shape of the earth’s orbit play a role, with ice sheets collapsing when the northern summers are especially warm, but only some of these so-called “great summers” result in deglaciation.
Recent ice cores from the Antarctic appear to have fingered the culprit at last: it’s all about plants. During ice ages, the level of carbon dioxide in the atmosphere steadily drops, because colder oceans absorb more of the gas. Eventually it reaches such a low level – about 0.018% at the peak of the last ice age – that plants struggle to grow at all, especially in dry areas or at high altitudes. As a result gigantic dust storms blanket the entire planet, reaching even Antarctica, where the amount of dust in the ice spikes dramatically upward. These dust storms blacken the northern ice sheets in particular, making them highly vulnerable to rapid melting when the next great summer arrives. The ice age was a horrible time to be alive even in the tropics: cold, dry, dusty and far less plant life than today.
As Svante Arrhenius, the Swede who first measured the greenhouse effect, said: “By the influence of the increasing percentage of carbonic acid in the atmosphere, we may hope to enjoy ages with more equable and better climates.”
Enjoy the lush greenery of the current world and enjoy the fact that green vegetation is changing faster than global average temperatures.
SOURCE
White House won't review climate science before election
The proposed White House panel that would conduct an "adversarial" review of climate science is dead for now, as President Trump grapples with negative perceptions of his environmental record at the outset of his reelection campaign.
The monthslong push from within the National Security Council to review established science on climate change divided White House advisers and generated sharp opposition from researchers across the country. The effort, led by a physicist overseeing technology issues at the NSC, William Happer, stalled indefinitely amid internal disagreements within the White House, according to two sources.
"It's been totally stymied by the forces of darkness within the administration, but also by the looming election campaign," said Myron Ebell, a senior fellow at the conservative Competitive Enterprise Institute who led the EPA transition team under Trump.
Happer has consulted conservative groups that attack climate science in an attempt to recruit members for the proposed panel. He's spoken with policy analysts at the Competitive Enterprise Institute, Heartland Institute and CO2 Coalition, a group Happer founded and that claims that the world would be better off with higher levels of carbon dioxide emissions. The theories promoted by those groups are rejected by NASA, NOAA and the world's top science academies.
Happer initially wanted Trump to issue an executive order to create the "Presidential Committee on Climate Security." He wanted the panel to review assertions within the National Climate Assessment related to risks from climate change on national security. Happer briefed Trump on climate science at least twice (Climatewire, June 24).
The idea to create the panel has caused strife within the White House. Among its critics are deputy chief of staff Chris Liddell; Kevin Hassett, the outgoing chairman of the Council of Economic Advisers; Larry Kudlow, director of the National Economic Council; and Kelvin Droegemeier, the president's science adviser. Those supporting the plan include Trump's son-in-law and senior adviser Jared Kushner and Brooke Rollins, assistant to Trump in the Office of American Innovation.
An official at NSC disputed the characterization that the panel was dead, even while confirming that it had been indefinitely delayed. The plan has suffered several downgrades over the months. It was initially proposed as a rapid response team of climate science critics who would challenge government publications on human-caused warming. Recent discussions have centered on the idea of forcing government climate scientists to participate in a debate with critics of their work who deny that humans are causing widespread changes on Earth (Climatewire, June 6). Most recently, the plan was diminished to creating dueling white papers that would elevate climate denialism to the level of consensus science.
Those in talks to participate as critics of mainstream science include John Christy of the University of Alabama, Huntsville, and Judith Curry, former head of the School of Earth and Atmospheric Sciences at Georgia Tech. A potential leader of the exercise was Paul Robinson, a former Department of Energy official who oversaw talks about nuclear weapons tests with the Soviet Union, but who is not trained in climate science.
Trump supporters who want the administration to be more aggressive in its rejection of climate science were frustrated that the climate review panel had been sidelined. Ebell of the Competitive Enterprise Institute sees it as a sign that the Trump campaign is sensitive to Democratic attacks on climate change.
"The reelect campaign has been completely taken over by the usual cast of Republican establishment consultants who are primarily concerned with making very large amounts of money on the campaign," Ebell said.
SOURCE
The Greatest Scientific Fraud Of All Time
The scandal that I call “The Greatest Scientific Fraud Of All Time” is the alteration of official world temperature data by a small number of government employees in the US and the UK. Uniformly, the alterations have the effect of lowering temperatures early in the record, and raising recent temperatures, in order to create and enhance a warming trend that does not exist in the data as originally reported. The purpose of the fraudulent data alteration is to support the continuation of the “global warming” climate scare. To read the prior 22 posts in this series, go to this link.
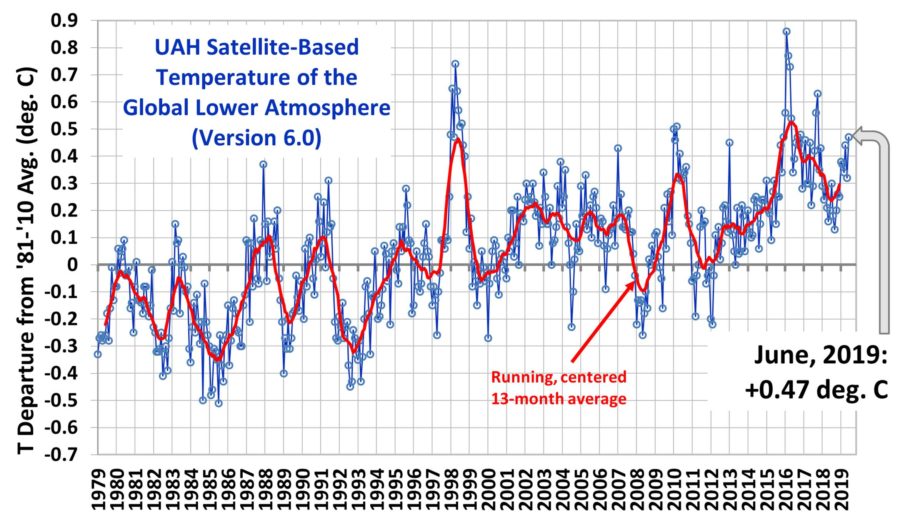
Despite what you might think from reading the mainstream press, the past few years in world temperatures have not been particularly good for the continuation of climate alarm. No matter how you measure them (the main methods being ground thermometers, weather balloons, and satellites), world atmospheric temperatures have gone down for more than three years since a peak reached in early 2016. The data set that I consider to be the most reliable — the satellite-based measurements from the University of Alabama at Huntsville — gives the global temperature “anomaly” for the most recent month (June 2019) as +0.47 deg C. That is well down from the peak of +0.88 deg C in early 2016, and represents a decrease of about a third of what had been the entire increase since the satellite record began in 1979. Here is the most recent UAH global lower atmosphere temperature graph:
The failure of temperatures to continue to rise in accordance with alarmist model predictions has left the alarm-promoting guys at NASA and NOAA without fodder for their former annual “hottest year ever!!!” press releases. From the NASA end-of-year-2018 release:
2018 Was the Fourth Warmest Year, Continuing Long Warming Trend. . . . The 2018 global temperature average ranks behind 2016, 2017, and 2015.
I leave it for you to figure out how a year that was down from 2017, which in turn was down from 2016, somehow “continues[es] [a] long warming trend.” In a real “long warming trend,” shouldn’t each year be successively warmer than the previous year?
So what is to be done? Readers of this series will not be surprised to learn that in this period where not so many people are looking, the temperature adjusters have been beavering away in the bowels of their collections of data, continuing to send inconvenient readings of the past down the memory hole, and to “adjust” the temperatures of the past down, and of the present up. Let me provide a small roundup of some things that have been discovered recently.
At NoTricksZone on June 25, Pierre Gosselin posts some work by a Japanese guy named Kirye. Kirye is a Japanese climate skeptic Twitter-blogger, but his Twitter page is in Japanese, so you probably won’t be able to read it. Kirye noticed that NASA came out on June 14 with a new version, version 4, of its surface-thermometer-based temperature series known as GISTEMP. GISTEMP v.4 is now based on the records of the also-newly-adjusted Global Historical Climate Network group of temperature stations, now called GHCN v.4. Kirye then analyzes the new data from NASA at six particular and widely-scattered weather stations: Punta Arenas, Chile; Marquette, Michigan; Port Elizabeth, South Africa; Davis, Antarctica; Hachijojima, Japan; and Valencia, Ireland.
Sure enough, there have been additional adjustments, as always in the same direction — older down, and newer up. But those adjustments between v.3 and v.4 have been relatively minor. More significantly, Kirye discovered a different maneuver which is even more incredible, and which he proves by direct links back to NASA’s own website: In the v.4 graphs that it provides, NASA has relabeled the hugely-adjusted v.3 data as “unadjusted.”
I’ll go in detail through just one of the sites for purposes of illustration. I pick Marquette, Michigan. The NASA graph for v.3 for that site can be found at this link. That graph shows both “unadjusted” and “adjusted” temperatures. The “unadjusted” graph shows a temperature peak in the 1930s followed by a substantial cooling trend since. The v.3 adjusted temperatures closely match the unadjusted in the recent years; but in the early years (1880 even to the 1970s) there are dramatic downward adjustments, averaging over 2 full deg C, thus creating a strong artificial warming trend. Then go to the brand-new NASA v.4 graph for the same site. The series that was labeled as “adjusted” on the v.3 graph has now been relabeled “unadjusted,” as a prelude to some further adjustments (which are less dramatic than the previous ones but still up to 1 deg C).
Kirye provides an animated comparison of the NASA v.3 and v.4 “unadjusted” temperature series. A small cooling trend in the v.3 unadjusted series has been turned into a strong warming trend in what is called v.4 “unadjusted” series (but is actually the v.3 adjusted series).
You can go to the links for the NASA graphs and verify that Kirye has accurately copied what they have done. Amazing. The exact same thing occurs at each of the five other sites, although the magnitude of the change in trend is not as great at the other sites. However, although the magnitude of the change in trend may vary, the direction of the change in trend created by the now-memory-holed “adjustments” is always the same — the warming trend is enhanced.
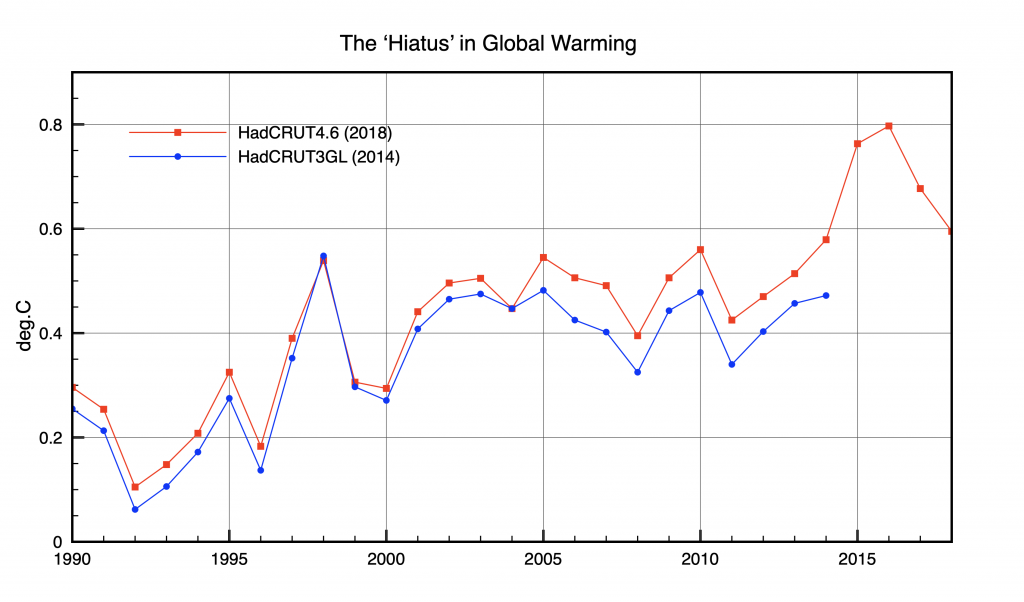
Another data point for today comes from the UK and from an independent blogger named Clive Best. Best reminds us that back in the period 1998 to 2013, there was something called the “hiatus,” where world temperatures failed to rise for a full 15 years despite ongoing calls for climate alarm. One of the data sources supporting the existence of the “hiatus” at the time was a UK-based surface temperature series called HadCRUT, coming from the Hadley Center at the University of East Anglia. In a post on June 24 titled “What Ever Happened To The Global Warming Hiatus?”, Best traces “adjustments” to the HadCRUT data series that have occurred in recent years. Turns out that in a series of seemingly very small adjustments, the “hiatus” has been completely erased. In the most recent data release, the years 2005, 2010 and 2014 have all suddenly turned out to have been warmer than 1998, although recorded at the time as cooler. Here is Best’s graph:
Funny that once again, each one of the adjustments somehow enhances the warming trend. Is it really possible that never once does any new data, or adjustment to data, lead to a change in the other direction?
And finally, over at the site Climate Scepticism on June 30, Paul Matthews notices that the Hadley guys have also recently come out with a new version of their sea surface temperature series, HadSST4. And how does this v.4 compare to the superseded v.3? I’ll bet you can’t guess:
Matthews points out the the larger tick marks on the graph are for 1850, 1900, 1950 and 2000. Anyway, just this most recent adjustment has added about 0.1 deg C to the claimed temperature increase. It may not seem like much, but remember, they “adjust” these things regularly, and every adjustment results in a little bit more of the ongoing artificial enhancement of the supposed warming.
SOURCE
Australia: Arrogant climate change protesters hand out vegan biscuits to frustrated drivers stopped from getting to work (and on with their lives) by their peak-hour protest
Furious commuters on their way to work in Brisbane's CBD were met with huge peak-hour traffic delays as climate change activists held a peaceful protest.
The Extinction Rebellion SEQ group held the demonstration in Brisbane on Thursday morning, demanding action on climate change and the Adani coal mine.
The group held up traffic as they stood on the road with signs and banners while frustrated commuters tried to make their way into the city.
Some activists tried to cheer up angered motorists by offering them vegan biscuits.
The group said protests would be taking place on Thursday, with around 40 activists on Elizabeth Street.
Other demonstrations were also planned to take on other streets in the city between 7.30am and 10:30am.
'Respectful civil disobedience has been shown to be the most effective form of demanding change,' Extinction Rebellion spokesperson Sergeio told the ABC.
'We cause disruption to society in order to allow our population to consider the climate emergency and what they will do about it.'
Motorists were less than impressed with the planned protest, stepping out of their cars to hurl abuse or beeping their horns.
One motorist was heard shouting at police 'why don't you arrest them?', according to the Courier Mail.
'Why don't they just get a f***ing job?' questioned another fed-up commuter, only to be handed a vegan biscuit in response.
It is the third time this month that demonstrations like this have happened.
The activists described the disruption as a 'minor inconvenience' in comparison to what will happen when Queensland mine officially starts operating.
More disruption is expected for next week when more protests are planned.
SOURCE
***************************************
For more postings from me, see DISSECTING LEFTISM, TONGUE-TIED, EDUCATION WATCH INTERNATIONAL, POLITICAL CORRECTNESS WATCH, FOOD & HEALTH SKEPTIC and AUSTRALIAN POLITICS. Home Pages are here or here or here. Email me (John Ray) here.
Preserving the graphics: Most graphics on this site are hotlinked from elsewhere. But hotlinked graphics sometimes have only a short life -- as little as a week in some cases. After that they no longer come up. From January 2011 on, therefore, I have posted a monthly copy of everything on this blog to a separate site where I can host text and graphics together -- which should make the graphics available even if they are no longer coming up on this site. See here or here
*****************************************


 Jim Hansen and his twin


No comments:
Post a Comment