
The charm of Chaamjamal
Chaamjamal appears to be a female statistican living in Thailand. She is a ferocious critic of global warming "science" -- using rigorous statistical analysis to detonate the sloppy Warmist claims. Unfortunately, she presents her findings in a very telegraphic way. She apparently cannot be bothered to present them as an orthodox academic journal article. I am of that mind myself these days. Writing academic journal articles is rarely worth it unless you are confirming some popular belief
That does mean that her work will be and is thoroughly ignored by Warmist scientists. They are interested only in work that supports their faith so doing the work needed to follow and critique her analyses would be of no interest to them. That is a pity but she is apparently unconcerned. She has no mission. She just puts down the facts and let them fall where they may.
She does however give enough information to follow her workings and they seem sound to me. She uses a big lot of graphs to illustrate her workings so I will not attempt to reproduce them here. I will simply reproduce her conclusions, which she offers in bullet-point form.
Her basic conclusion is that there is no relationship between human CO2 emissions and global temperature
Fossil Fuel Emissions and Atmospheric Composition
* Figure 1 shows that atmospheric CO2 concentration as measured at Mauna Loa has been rising steadily since 1958 while at the same time post industrial humans have been injecting increasing amounts of carbon dioxide from fossil fuels into the atmosphere. It is in this context that the usual assumption is made that observed changes in atmospheric CO2 concentration (ΔCO2) are driven by fossil fuel emissions. This assumed relationship appears to be visually validated in the left panels of the five charts in Figure 3 where changes in atmospheric carbon dioxide (ΔCO2) appear to be strongly correlated with the rate of emissions.
* The correlation was tested in a related work [LINK] where it was shown with detrended correlation analysis that there is insufficient evidence to claim that atmospheric CO2 concentration is responsive to fossil fuel emissions at an annual time scale and that therefore the attribution of rising atmospheric CO2 to emissions is without empirical support. Detrended correlation analysis extracts the portion of the observed source data correlation that derives from responsiveness at the chosen time scale by removing the portion that derives from shared trends. The motivation for this procedure is described in a related post [LINK] . Briefly, the trend is removed from the data so that only the regression residuals remain and a correlation between these residuals is used to measure the responsiveness of ΔCO2 to emissions.
* This work is a further investigation into the relationship between changes in atmospheric CO2 concentration and fossil fuel emissions. The failure of the prior study to find a responsiveness of atmospheric CO2 to fossil fuel emissions at an annual time scale leaves open the possibility that a responsiveness may exist at longer time scales. Five time scales from one year to five years in increments of one year are studied. The data for the five time scales are displayed in Figure 2 which contains five charts one for each time scale. Each chart consists of three frames. The left frame shows emissions at the time scale of the chart in gigatons of carbon equivalent (GTC). The middle frame displays the corresponding increase in atmospheric CO2 converted from parts per million in volume (ppmv) to GTC equivalent. The last frame contains the ratio of ΔCO2 to emissions. This ratio, called the “Airborne Fraction (A/F)” is considered to be a constant with a value of approximately 50%. It describes the portion of emissions that end up in the atmosphere. The spread of the Airborne Fraction appears to include the value of A/F = 0.5 and the spread appears to narrow as the time scale is increased. Curiously, a slight downward trend is seen in the A/F at all time scales. The Airborne Fraction concept appears to assume a causal relationship between emissions and change in atmospheric CO2 concentration. The results are summarized in Figure 4. The volatility of the Airborne Fraction decreases sharply from Range=0.8 to Range =0.29 as the time scale is increased from T/S=1 to T/S=5 and at the longer time scales the median A/F converges nicely to the original IPCC figure of A/F=0.5. Later claims to reduced figures of A/F=0.42 seems arbitrary and perhaps a case of circular reasoning as explained in a related post [LINK]
* The correlation analysis is presented in Figure 3. There are five charts one for each time scale. Each chart consists of two frames, a left frame that displays correlation in the source data and a right frame that shows the correlation between the detrended series. Both of these correlations rise as the time scale is increased from one to five years. At all five time scales we find a significant loss in correlation when the data are detrended. The correlation that survives into the detrended series serves as evidence of responsiveness at each of the five time scales. The survival fraction also rises as the time scale is increased from annual to five years. The results are summarized in Figure 5. Here we see that the source correlation rises from CORR=0.742 to CORR=0.921 as we increase the time scale from T/S=1 to T/S=5. The corresponding detrended correlation also rises from DETCOR=0.145 to DETCOR=0.314 with the corresponding survival fraction rising sharply from 19.5% to 34.1%.
* The higher and higher detrended correlations and survival fractions at longer time scales raise the intriguing possibility that the failure to find a responsiveness of atmospheric composition to the rate of fossil fuel emissions was an inappropriate choice of an annual time scale. Perhaps a longer time scale will resolve the issue. To test that hypothesis we present one tailed hypothesis tests for each of the five detrended correlations at the five selected time scales. Here the alternate hypothesis is that the detrended correlation is positive or HA: DETCOR>0. The corresponding null hypothesis is that is not positive or H0: DETCOR<=0. The maximum false positive error rate is set to α=0.001, much lower than the usual values of α=0.01 to α=05, in accordance with Revised Standards for Statistical Significance (Johnson, 2013) published by the NAS to address an unacceptable rate of irreproducible results in published research (Siegfried, 2010). Since five comparisons are made for the five different time scales, the probability of finding at least one significant correlation in random data is increased by a factor of five to 0.005 (Holm, 1979). The results of the hypothesis tests are presented in Figure 5. Here EFFN=effective value of the sample size corrected for time scale which decreases from EFFN=60 to EFFN=12 as the time scale is increased from T/S=1 to T/S=5 to account for residual unique information in the time series. The procedure and rationale for this computation are described in a related work [LINK] . Along with the effective sample size, the degrees of freedom also falls since in this case degrees of freedom is computed as DF=EFFN-2. Thus, although the T-statistic rises from TSTAT=1.132 to TSTAT=2.478 as the time scale is increased from T/S=1 to T/S=5, the PVALUE for the hypothesis test does not fall as quickly as one would expect and in fact it actually rises from T/S=4 to T/S=5. More relevant to the research question here, none of the five PVALUEs is even close to the critical value of the PVALUE=0.001. We therefore fail to reject H0: DETCOR<=0 and conclude that the data do not provide evidence that atmospheric CO2 concentration is responsive to fossil fuel emissions at any of the time scales studied. We note also that since the p-value rose from T/S=4 (p-value=0.0135) to T/S=5 (p-value=0.0163), in time scales greater than T/S=4, the effect of longer time scale on degrees of freedom overcomes its effect on detrended correlation at the available time span of the data. Thus even though a stable Airborne Fraction can be computed as A/F=0.5, its interpretation in terms of the contribution of fossil fuel emissions to ΔCO2 requires the use of circular reasoning with an assumed responsiveness that is not found in the data. Related post [LINK] .
* A rationale for the inability to relate changes in atmospheric CO2 to fossil fuel emissions is described by Geologist James Edward Kamis in terms of natural geological emissions due to plate tectonics [LINK] . The essential argument is that, in the context of significant geological flows of carbon dioxide and other carbon based compounds, it is a form of circular reasoning to describe changes in atmospheric CO2 only in terms of human activity. It is shown in a related post, that in the context of large uncertainties in natural flows, it is not possible to detect the presence of fossil fuel emissions without the help of circular reasoning [LINK] .
* The results of detrended correlation analysis at five time scales shows that the failure to find a responsiveness of atmospheric composition to fossil fuel emissions in a related work [LINK] cannot be ascribed to the annual time scale used in the study as the result is validated at longer time scales to the point of diminishing returns. We conclude that atmospheric composition specifically in relation to the CO2 concentration is not responsive to the rate of fossil fuel emissions. This finding is a serious weakness in the theory of anthropogenic global warming by way of rising atmospheric CO2 attributed to the use of fossil fuels in the industrial economy; and of the “Climate Action proposition of the UN that reducing fossil fuel emissions will moderate the rate of warming by slowing the rise of atmospheric CO2.
SOURCE
Tracking Progress on Disasters, 2018 Update
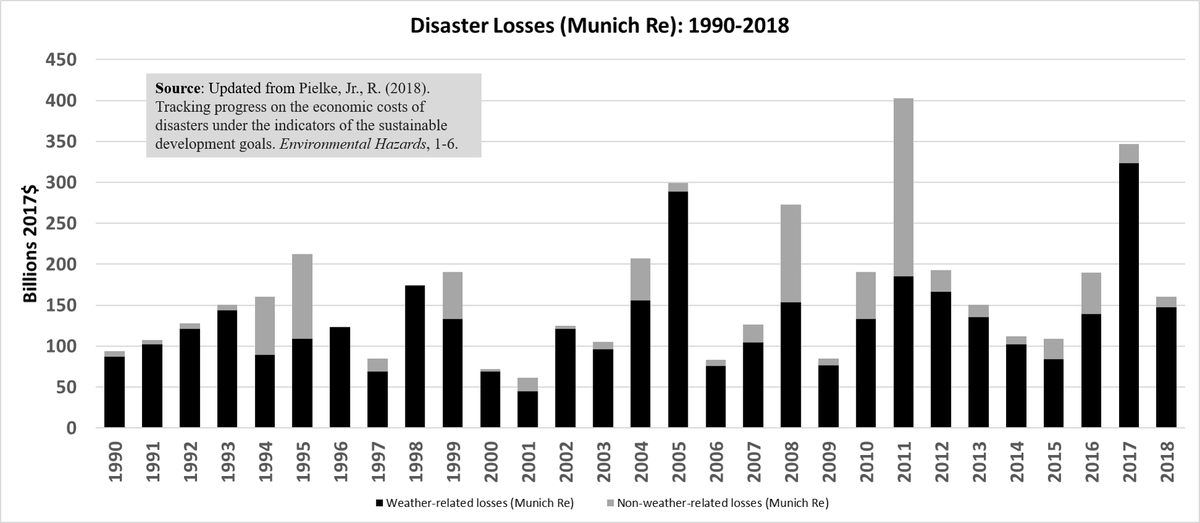
The figure above shows disaster losses as tracked by Munich re from 1900 to 2018, based on an update published earlier this week (here). The update allows me to add another year to the data reported in this paper: "Pielke, R. (2018). Tracking progress on the economic costs of disasters under the indicators of the sustainable development goals. Environmental Hazards, 1-6."
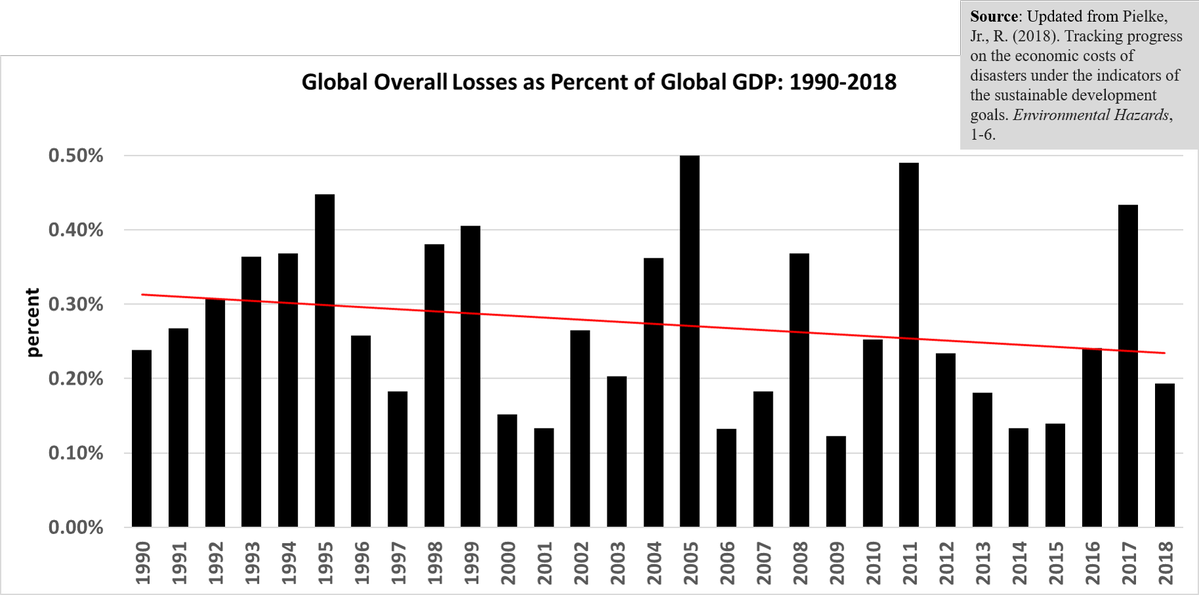
The graphs below show losses as a percentage of global GDP from 1990 to 2018, for all catastrophes (top) and those that are weather/climate related (bottom)

Overall losses were at about the 1990-2017 average ($160b vs $163b)
Weather/Climate losses were above the 1990-2017 average ($147B vs $129B)
Overall losses are well below the 1990-2017 average (0.19% vs 0.28%)
Weather/Climate losses are slightly below 1990-2017 average (0.18% vs 0.22)
Bottom line: 2018 saw substantial disasters with large costs. However, in terms of economic damage it was a fairly typical year in historical context.
2018 contributes to the trend (1990-2018) of disaster losses decreasing as a proportion of global GDP.
This is good news.
SOURCE
Funding The Climate-Industrial Complex
Supposedly “green” or “renewable” energy has become a trillion-dollar-plus annual industry that has spawned tens of thousands of new businesses worldwide. The total Climate-Industrial Complex is a $2-trillion-per-year business. Major fossil fuel companies like Shell Energy now have green energy divisions.
These companies are virtually 100% dependent on the politically driven notion of “dangerous man-made global warming and climate change.” The media, public and political establishment constantly recite the assertion that 97% of scientists say the problem is real and man-made carbon dioxide (CO2) is the cause.
However, increased concentrations of CO2 in the atmosphere do not lead to global warming and climate change. Carbon dioxide is a trace gas in the atmosphere. The major “greenhouse gas” is water vapor.
An intricate feedback system regulates the Earth’s temperature, maintaining immunity from temperature increases and decreases due to such trace gases.
Furthermore, the false notion of CO2-driven climate change is responsible for the potential massive redistribution of wealth from now-wealthy industrialized nations to poor countries.
This has led to the corrupt worldwide business of carbon tax credit trading and more money to fund wind, solar and biofuel energy. Green industries should not predicate their business models on false claims about climate change.
They should base their businesses and R&D budgets on the fact that fossil fuels will become less economically viable over the coming decades as easily recovered reserves are depleted.
Renewables such as solar and wind cannot provide material amounts of energy required worldwide – and require vast amounts of metals and other materials that are themselves not renewable or sustainable.
Utilities and energy companies must be free to use petroleum, coal, natural gas and biofuels at market-demand costs and must increase nuclear energy production. New sources of high energy density power generation must be created.
Today the “green energy” or “renewables” sector of the power generation industry is driven by the perceived but not scientifically proven notion that carbon dioxide resulting from the burning of fossil fuels and bio-fuels cause “global warming” or “climate change.”
This is based on incorrect ideas about the real practical effects that “greenhouse gases” cause when introduced into our atmosphere.
This chart demonstrates in dramatic fashion that there is absolutely no connection between steadily rising CO2levels and nearly stable to slightly higher average global temperatures over the past four decades.

CO2 Temp Chart
Water vapor is the gaseous form of water and is by far the most important greenhouse gas. Its spectral absorption is wider than that of carbon dioxide – meaning its absorption of photons from the Sun, as radiated by the Earth’s surface at night across the wider electromagnetic radiation (EMR) spectrum, causes a higher rise in molecular vibrational momentum, equating to higher thermal rise than carbon dioxide.
Furthermore, the water vapor content in the lower atmosphere varies from 10,000 PPM or 1% to 40,000 PPM or 4% – whereas carbon dioxide is ≈ 400 PPM or 0.04% of the atmosphere. That is many orders of magnitude.
This suggests that water vapor has a much greater effect as a greenhouse gas than carbon dioxide. Water vapor is responsible for well over 98% of any “greenhouse effect.”
It is theoretically possible that carbon dioxide and other non-condensable greenhouse gases like methane, nitrous oxide and ozone can create minute increases in thermal absorption and therefore could increase the amount of water vapor in the atmosphere via a “positive feedback cycle,” leading to warming and an increase in evaporation of sea water.
However, the trace amounts of these gases would lead to virtually undetectable and immeasurable temperature and water vapor increases. Moreover, adding more water vapor to the atmosphere would also produce a negative feedback effect.
This could happen as more water vapor leads to more cloud formation. Clouds reflect sunlight and reduce the amount of energy that reaches the Earth’s surface to warm it. If the amount of solar warming decreases, then the temperature of the Earth would decrease.
In that case, adding more water vapor would result in global cooling, rather than warming. But cloud cover does mean more condensed water in the atmosphere, making for a stronger greenhouse effect than non-condensed water vapor alone.
It is warmer on a cloudy winter day than on a clear one.
Thus the possible positive and negative feedbacks associated with increased water vapor and cloud formation will largely cancel one another out and further complicate the ability to model these feedback cycles using computer simulation and mathematical modeling.
Many in the “renewables energy” industry will object to this analysis, because they see it as undermining their reason to exist, affecting investor interest and sales opportunities. They miss the key point.
We do need to find replacements for fossil fuels – but not because of “climate change.” The real driver is the absolutely indisputable fact that we are depleting economically viable sources of fossil fuels, while at the same time increasing our demand for energy worldwide.
The key term is “economically viable,” because the petroleum industry will be forced to pursue more difficult to recover deposits of oil and natural gas, while also enduring ever-increasing amounts of litigation.
Today the only viable energy source beyond fossil fuels is nuclear fission. Our nuclear energy industry must be rebuilt if America is to remain a leader in energy, economic growth, and opportunity.
We must also continue our research and development in fusion energy which has many advantages over nuclear fission if it is ever perfected.
We commissioned an objective science-based analysis of solar power as a means to generate 100% of baseload power in the USA based on current demand. The results are clear: solar power for baseload electricity is simply unrealistic.
It is a virtual impossibility to power America from solar energy based on the science, let alone the economics, reliability or land and material requirements. Electrifying the transportation infrastructure will increase this impossibility several-fold. The same is true of wind power.
We must develop the next generation of very high energy density nuclear power – first nuclear fission, to be replaced possibly by fusion in the mid to late 21st Century.
We must also learn to conserve energy and materials better, not to save the planet from man-made climate change, but to give mankind more time to develop a high flux density energy generation science and technology.
In December 2018, both Excel Energy and Northern Indiana Public Service Company (NIPSCO) announced plans to convert to 100% renewable green energy generation by 2050.
That is a scientific impossibility unless policymakers and environmentalist alike redefine nuclear energy as green.
Why would they make such claims? For Excel boosting stock prices through subsidies comes to mind.
NIPSCO is a government-protected monopoly utility, with Indiana state government guaranteeing NIPSCO a profit of approximately 10% for every dollar it spends. That means NIPSCO has an obvious financial self-interest to engage in costly business practices.
Building expensive new power facilities, even when existing facilities are working perfectly well, is one of the most effective ways for NIPSCO to ramp up its spending and guaranteed profits.
Of course, both companies do so at the expense of consumers, many of whom have no knowledge that their electricity bills are about to rise substantially.
(To learn more about fusion energy, its promise and scientific difficulties facing it, visit our website Fusion4Freedom.com. For information about what energy is and where it comes from, see “Energy Basics: Where does energy on our planet come from?” Go here to learn more about Excel Energy’s deceptive and wholly unrealistic plans– and here for more about NIPSCO’s wholly unrealistic plans.)
Let energy buyers beware. Politicians, activist groups and industrialists are all using “climate change” to increase their power and income. We need to figure out what they’re doing – and fight back.
SOURCE
Green Deal Fiasco: Thousands Face Massive Energy Bills After Failure Of UK Energy Scam
Thousands of homeowners face rip-off energy bills for decades after being ‘scammed’ into joining a state-backed £400million eco-energy scheme that ‘utterly failed’.
The Green Deal – which ministers trumpeted as the ‘biggest home improvement programme since the Second World War’ – was abandoned after two years as MPs admitted it had been a ‘complete fiasco’ that brought almost no environmental benefits.
But more than three years after its collapse, families remain trapped repaying loans of up to £21,000 which they unwittingly took out for solar panels, replacement boilers, and insulation.
The repayments are added to monthly utility bills which in some cases have quadrupled once the loans were added to the cost of their usual fuel and will take more than 20 years to pay back.
In some of the worst cases, the scheme was allowed to be ruthlessly exploited by Government-approved ‘gangster companies’ who conned the elderly and vulnerable, including those with dementia, MPs told the Commons.
Because loans were attached to a property, many victims are unable to sell their home and are effectively ‘imprisoned’ in them for the rest of their lives. The result has been ‘years of agony’ for people fighting for compensation.
MPs have now called for urgent action, saying the scandal showed the UK’s system of regulation is ‘simply not fit for purpose’.
When the Green Deal was launched by the Coalition Government in January 2013, climate minister Greg Barker said it would make 14 million homes more energy efficient by 2020 and upgrade the UK’s entire building stock by 2030.
The aim was to encourage homeowners to save energy by installing loft and wall insulation, more efficient boilers, solar panels, and ground source heat pumps at no up-front cost.
Homeowners were lent cash via private companies with repayments collected through energy bills in what was described as ‘pay as you save.’
But take-up was far lower than hoped, largely because the interest rate for loans was almost 14 times the Bank of England rate at the time, meaning that in almost every case it would be cheaper for a homeowner to raise the cash needed off their own house.
Ministers finally announced they were pulling financial support for the Green Deal in July 2015 to ‘protect taxpayers’ because of low take-up and ‘concerns about industry standards.’
But nearly four years later, thousands of people are still paying the price. In 2017 the Government sold the Green Deal loan book to a private firm, which now deals with consumer complaints.
SNP MP Gavin Newlands said the Green Deal ‘failed utterly’. He told the Commons: ‘Through their incompetence, the UK Government has in some cases allowed unscrupulous operators to prey on vulnerable families who ultimately just want to be able to go back to a warm home every day’.
SOURCE
Ecofascism in South Australia
Free plastic waste is almost entirely a 3rd world problem but it gives Greenies erections to blame it on us
South Australians may soon be banned from using a range of single-use plastics as the government considers a major crackdown.
Plastic items such as straws, cutlery, shopping bags and coffee cups are on the chopping block after the state’s Environment Minister, David Speirs, released two discussion papers on the issue yesterday.
One deals with the possible single-use plastic ban and the other is a review of the state’s container deposit scheme reviewing what sort of containers should be included and whether the refund amount should be revised.
Mr Speirs said it was important to keep the impact of single-use plastics at the forefront of conversation so South Australia could continue to be the national leader in recycling.
“I am keen to keep South Australia at the forefront of these areas, and to maintain this position while also increasing economic activity,” Mr Speirs said.
“Plastic is a valuable material, integral to modern life. But when littered, it ruins our environment’s pristine image, and harms marine and terrestrial life.”
There is a growing global trend towards doing away with plastics and Mr Speirs said it was important for South Australia to keep up.
The European Union announced its intention on October to ban a range of plastic items.
“We can take more immediate local action on items that are designed and intended for disposal after only a single use, are prone to being littered, are unlikely to be recycled and for which more sustainable alternatives are available,” Mr Speirs said.
Mr Speirs’ paper, entitled “Turning the tide on single-use plastic products”, suggests a ban on these products be implemented the same way single-use plastic bags were banned at check-outs across the state in 2009.
Switching from lightweight shopping bags to reusable ones has resulted in 400 million bags being removed from circulation in South Australia, according to the paper.
The paper seeks views from the community and business on what they consider are the problems associated with plastic products, alternatives and if there is a need for government intervention.
Environmental groups, including Conservation SA, have welcomed the government’s move.
“Despite this, the recent State of the Environment Report shows that per capita waste in SA still increased by over 40 per cent over the last five years,” chief executive Craig Wilkins said. “It’s time for stronger action.”
SOURCE
***************************************
For more postings from me, see DISSECTING LEFTISM, TONGUE-TIED, EDUCATION WATCH INTERNATIONAL, POLITICAL CORRECTNESS WATCH, FOOD & HEALTH SKEPTIC and AUSTRALIAN POLITICS. Home Pages are here or here or here. Email me (John Ray) here.
Preserving the graphics: Most graphics on this site are hotlinked from elsewhere. But hotlinked graphics sometimes have only a short life -- as little as a week in some cases. After that they no longer come up. From January 2011 on, therefore, I have posted a monthly copy of everything on this blog to a separate site where I can host text and graphics together -- which should make the graphics available even if they are no longer coming up on this site. See here or here
*****************************************


 Jim Hansen and his twin


No comments:
Post a Comment