
NASA says that burning hydrocarbons COOLs the earth
There are various sources of CO2 in the atmosphere. Breathing out is a major one. Burning hydrocarbons like coal and oil is another source. But burning hydrocarbons tend to emit aerosols such as soot in addition to CO2. What is the effect of those aerosols? NASA has finally had a stab at answering that. Their summary of their findings is below. And they find, as expected, a cooling effect from atmospheric aerosols.
Amusingly, however, they do not offer a calculation of how far aerosol effects cancel out CO2 effects -- but instead blather on about how aerosols and other cooling influences vary from region to region. That suggests to me that in some regions (China?) the aerosols have a effect at least equal to the calculated CO2 effects. So if we all returned to burning lots of coal we could cancel out any warming effects from the CO2 emitted. Goodbye global warming!
No precise calculations are of course possible as the degree to which the global temperature responds to CO2 changes is very much in dispute on both theoretical and empirical grounds. It is pretty much a number plucked out of the air -- and one that is heavily challenged by both the current temperature plateau and the even longer 1945 to 1975 plateau.
But, clearly, the attack on coal may have been entirely misconceived. Its OVERALL effects might have zero influence on global temperatures. Back to the drawing board? No. Warmists never retreat no matter how often they are shown to be overlooking things. It's faith, not science
Researchers have relied on simplifying assumptions when accounting for the temperature impacts of climate drivers other than carbon dioxide, such as tiny particles in the atmosphere known as aerosols, for example. It is well known that aerosols such as those emitted in volcanic eruptions act to cool Earth, at least temporarily, by reflecting solar radiation away from the planet. In a similar fashion, land use changes such as deforestation in northern latitudes result in bare land that increases reflected sunlight.
But the assumptions made to account for these drivers are too simplistic and result in incorrect estimates of TCR and ECS, said climate scientist Gavin Schmidt, the director of NASA's Goddard Institute for Space Studies (GISS) in New York and a co-author on the study. “The problem with that approach is that it falls way short of capturing the individual regional impacts of each of those variables,” he said, adding that only within the last ten years has there been enough available data on aerosols to abandon the simple assumption and instead attempt detailed calculations.
In a NASA first, researchers at GISS accomplished such a feat as they calculated the temperature impact of each of these variables — greenhouse gases, natural and manmade aerosols, ozone concentrations, and land use changes — based on historical observations from 1850 to 2005 using a massive ensemble of computer simulations. Analysis of the results showed that these climate drivers do not necessarily behave like carbon dioxide, which is uniformly spread throughout the globe and produces a consistent temperature response; rather, each climate driver has a particular set of conditions that affects the temperature response of Earth.
The new calculations reveal their complexity, said Kate Marvel, a climatologist at GISS and the paper's lead author. “Take sulfate aerosols, which are created from burning fossil fuels and contribute to atmospheric cooling,” she said. “They are more or less confined to the northern hemisphere, where most of us live and emit pollution. There's more land in the northern hemisphere, and land reacts quicker than the ocean does to these atmospheric changes.”
More HERE
1979 – UN Was Pushing The Global COOLING Scam
In 1979, the UN WMO was pushing the global cooling scam, and blamed droughts, floods and climate change on it.

Climate scientists now cleverly start their graphs in 1979, and ignore earlier data.
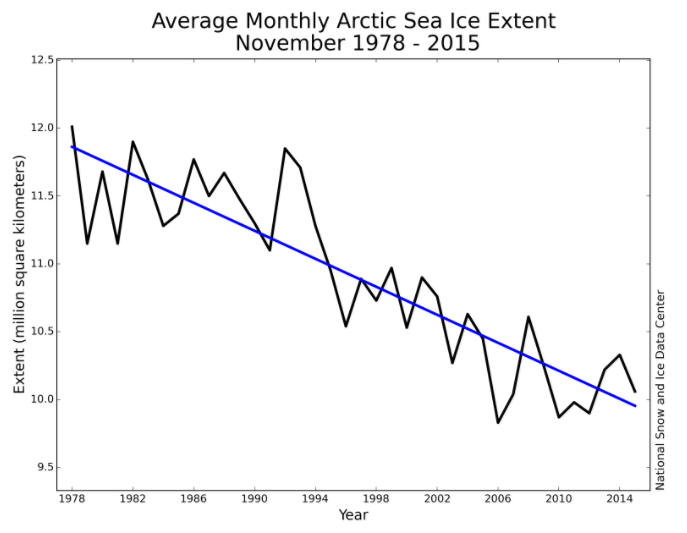
The 1990 IPCC report showed sea ice data back to 1973, which scientists have since erased.

SOURCE
The Most Comprehensive Assault On 'Global Warming' Ever
It made sense. Knowing that CO2 is a greenhouse gas and that our industrialized world is adding a large amount of it to the atmosphere on a yearly basis, I accepted the premise that this would cause global temperatures to rise. But one day about 7 years ago, I looked at the ubiquitous graph showing the “global” temperature of the last 150 years and noticed something odd. It was subtle, and as I found out later, disguised so that it would be overlooked. There appeared to be a period of about 40 years between 1940 and 1980 where the global temperatures actually declined a bit. As a data analysis expert, I could not ignore that subtle hint and began to look into it a little more. Forty years is a long time, and while carbon dioxide concentrations were increasing exponentially over the same period, I could not overlook that this showed an unexpected shift in the correlation between global temperatures and CO2 concentrations. Thus I began to look into it a little further and here are some of the results 7 years later.
Before we begin, let’s establish what we know to be correct. The global average temperature has increased since the 1980’s. Since the 1980’s glaciers around the world are receding and the ice cap of the Arctic Ocean has lost ice since the 1980’s, especially during the summer months. The average global temperature for the last 10 years is approximately 0.35 degrees centigrade higher than it was during the 1980’s. The global warming community has exploited these facts to “prove” that human activity (aka burning of fossil fuels) is the cause of these increasing temperatures. But no direct scientific proof or data has been shown that link the current observations to human activity. The link is assumed to be simply a fact, with no need to investigate or discuss any scientific data.
Here are 10 of the many scientific problems with the assumption human activity is causing “global warming” or “climate change”:
1. Temperature records from around the world do not support the assumption that today’s temperatures are unusual.
The all-time high temperature record for the world was set in 1913, while the all-time cold temperature record was set in 1983. By continent, all but one set their all-time high temperature record more recently than their all-time cold temperature records. In the United States, which has more weather stations than any other location in the world, more cold temperature records by state were set more recently than hot temperature records. When the temperature records for each state were considered for each month of the year, a total of 600 data points (50 states x 12 months), again cold temperature records were set in far greater numbers more recently and hot temperature records were set longer ago. This is directly contradictory to what would be expected if global warming were real.
2. Satellite temperature data does not support the assumption that temperatures are rising rapidly:
Starting at the end of 1978, satellites began to collect temperature data from around the globe. For the next 20 years, until 1998, the global average temperature remained unchanged in direct contradiction to the earth-bound weather station data, which indicated “unprecedented” temperature increases. In 1998 there was a strong El Nino year with high temperatures, which returned to pre-1998 levels until 2001. In 2001 there was a sudden jump in the global temperature of about 0.3 degrees centigrade which then remained at about that level for the next 14 years, with a very slight overall decrease in the global temperatures during that time.
3. Current temperatures are always compared to the temperatures of the 1980’s, but for many parts of the world the 1980’s was the coldest decade of the last 100+ years:
If the current temperatures are compared to those of the 1930’s one would find nothing remarkable. For many places around the world, the 1930’s were the warmest decade of the last 100 years, including those found in Greenland. Comparing today’s temperatures to the 1980’s is like comparing our summer temperatures to those in April, rather than those of last summer. It is obvious why the global warming community does this, and very misleading (or deceiving).
4. The world experienced a significant cooling trend between 1940 and 1980:
Many places around the world experienced a quite significant and persistent cooling trend to the point where scientists began to wonder if the world was beginning to slide into a new ice age period. For example, Greenland experienced some of the coldest years in 120 years during the 1980’s, as was the case in many other places around the world. During that same 40-year period, the CO2 levels around the world increased by 17%, which is a very significant increase. If global temperatures decreased by such a significant amount over 40 years while atmospheric CO2 increased by such a large amount we can only reach two conclusions:
1. There must be a weak correlation, at best, between atmospheric CO2 and global temperatures, 2. There must be stronger factors driving climate and temperature than atmospheric CO2.
5. Urban heat island effect skews the temperature data of a significant number of weather stations:
It has been shown that nighttime temperatures recorded by many weather stations have been artificially raised by the expulsion of radiant heat collected and stored during the daytime by concrete and brick structures such as houses, buildings, roads, and also cars. Since land area of cities and large towns containing these weather stations only make up a very small fraction of the total land area, this influence on global average temperature data is significant. Since the daytime and nighttime temperatures are combined to form an average, these artificially-raised nighttime temperatures skew the average data. When one only looks at daytime temperatures only from larger urban areas, the “drastic global warming” is no longer visible. (This can also be seen when looking at nearby rural area weather station data, which is more indicative of the true climate of that area).
6. There is a natural inverse relationship between global temperatures and atmospheric CO2 levels:
Contrary to what would be assumed when listening to global warming banter or while watching An Inconvenient Truth, higher temperatures increase atmospheric CO2 levels and lower temperatures decrease atmospheric CO2 levels, not the other way around. Any college freshman chemistry student knows that the solubility of CO2 decreases with increasing temperatures and thus Earth’s oceans will release large amounts of CO2 to the atmosphere when the water is warmer and will absorb more CO2 when the water is colder. That is why the CO2 level during the ice ages was so much lower than the levels today. That doesn’t take away the fact that we are artificially raising the atmospheric CO2 levels, but just because we do, that doesn’t mean that this will cause temperatures to increase in any significant way. The 40-year cooling period between 1940 and 1980 appear to support that premise. What we can conclude is that the ice ages were not caused by changes in the atmospheric CO2 levels and that other stronger factors were involved with these very large climate changes.
7. The CO2 cannot, from a scientific perspective, be the cause of significant global temperature changes:
The CO2 molecule is a linear molecule and thus only has limited natural vibrational frequencies, which in turn give this molecule only limited capability of absorbing radiation that is radiated from the Earth’s surface. The three main wavelengths that can be absorbed by CO2 are 4.26 micrometers, 7.2 micrometers, and 15.0 micrometers. Of those 3, only the 15-micrometer is significant because it falls right in range of the infrared frequencies emitted by Earth. However, the H2O molecule which is much more prevalent in the Earth’s atmosphere, and which is a bend molecule, thus having many more vibrational modes, absorbs many more frequencies emitted by the Earth, including to some extent the radiation absorbed by CO2. It turns out that between water vapor and CO2, nearly all of the radiation that can be absorbed by CO2 is already being absorbed. Thus increasing the CO2 levels should have very minimal impact on the atmosphere’s ability to retain heat radiated from the Earth. That explains why there appears to be a very weak correlation at best between CO2 levels and global temperatures and why after the CO2 levels have increased by 40% since the beginning of the industrial revolution the global average temperature has increased only 0.8 degrees centigrade, even if we want to attribute all of that increase to atmospheric CO2 increases and none of it to natural causes.
8. There have been many periods during our recent history that a warmer climate was prevalent long before the industrial revolution:
Even in the 1990 IPCC report a chart appeared that showed the medieval warm period as having had warmer temperatures than those currently being experienced. But it is hard to convince people about global warming with that information, so five years later a new graph was presented, now known as the famous hockey stick graph, which did away with the medieval warm period. Yet the evidence is overwhelming at so many levels that warmer periods existed on Earth during the medieval warm period as well as during Roman Times and other time periods during the last 10,000 years. There is plenty of evidence found in the Dutch archives that shows that over the centuries, parts of the Netherlands disappeared beneath the water during these warm periods, only to appear again when the climate turned colder. The famous Belgian city of Brugge, once known as “Venice of the North,” was a sea port during the warm period that set Europe free from the dark ages (when temperatures were much colder), but when temperatures began to drop with the onset of the little ice age, the ocean receded and now Brugge is ten miles away from the coastline. Consequently, during the medieval warm period the Vikings settled in Iceland and Greenland and even along the coast of Canada, where they enjoyed the warmer temperatures, until the climate turned cold again, after which they perished from Greenland and Iceland became ice-locked again during the bitter cold winters. The camps promoting global warming have been systematically erasing mention of these events in order to bolster the notion that today’s climate is unusual compared to our recent history.
9. Glaciers have been melting for more than 150 years
The notion of melting glaciers as prove positive that global warming is real has no real scientific basis. Glaciers have been melting for over 150 years. It is no secret that glaciers advanced to unprecedented levels in recent human history during the period known as the Little Ice Age. Many villages in the French, Swiss, and Italian Alps saw their homes threatened and fields destroyed by these large ice masses. Pleas went out to local bishops and even the Pope in Rome to come and pray in front of these glaciers in the hope of stopping their unrelenting advance. Around 1850, the climate returned to more “normal” temperatures and the glaciers began to recede. But then between 1940 and 1980, as the temperatures declined again, most of the glaciers halted their retreat and began to expand again, until warmer weather at the end of the last century caused them to continue the retreat they started 150 years earlier. Furthermore, we now know that many of the glaciers around the world did not exist 4000 to 6000 years ago. As a case in point, there is a glacier to the far north of Greenland above the large ice sheet covering most of the island called the Hans Tausen Glacier. It is 50 miles long ,30 miles wide and up to 1000 feet thick. A Scandinavian research team bored ice cores all the way to the bottom and discovered that 4000 years ago this glacier did not exist. It was so warm 4000 years ago that many of the glaciers around the world didn’t exist but have returned because of the onset of colder weather. Today’s temperatures are much lower than those that were predominant during the Holocene era as substantiated by studying the many cores that were dug from Greenland’s ice sheet.
10. “Data adjustment” is used to continue the perception of global warming:
For the first several years of my research I relied on the climate data banks of NASA and GISS, two of the most prestigious scientific bodies of our country. After years of painstaking gathering of data, and relentless graphing of that data, I discovered that I was not looking at the originally gathered data, but data that had been “adjusted” for what was deemed “scientific reasons.” Unadjusted data is simply not available from these data banks. Fortunately I was able to find the original weather station data from over 7000 weather stations from around the world in the KNMI database. (Royal Dutch Meteorological Institute). There I was able to review both the adjusted and unadjusted data as well as the breakout of the daytime and nighttime data. The results were astounding. I found that data from many stations around the world had been systematically “adjusted” to make it seem that global warming was happening when, in fact, for many places around the world the opposite was true. Following will be a few of the myriad of examples of this data adjustment. When I present my material during presentations at local colleges, these are the charts that have some of the greatest impact in affecting the opinion of the students, especially when they realize that there is a concerted effort to misrepresent what is actually happening. Another amazing result was that when only graphing the daily highs from around the country, a very different picture arises from the historical temperature data.
There are many more specific areas that I have researched and for which I have compiled data and presentation material, equally compelling regarding at exposing the fallacies of global warming. A new twist has swept the global warming movement lately, especially since they had to admit that their own data showed that there was a “hiatus” on the warming, as illustrated in the 2014 IPCC report; their data showed an actual cooling over the last 10 years. The new term: “climate change” is now taking over, such that unusual events of any kind, like the record snowfall in Boston, can be blamed on the burning of fossil fuels without offering any concrete scientific data as to how one could cause the other.
SOURCE
North Carolina uses unique tactic against new EPA power rule
Already among the two-dozen states suing to overturn new power plant emission rules, North Carolina is picking a separate fight with the Environmental Protection Agency by adopting a plan for compliance the agency is likely to reject.
State officials hope that will create a shortcut to a federal appeals court and head off any attempt by the EPA to drag out the court case while its rules get further entrenched.
North Carolina's approach is unique because it splits the difference between the handful of states that have said they won't submit any plan to the EPA, and about a dozen that are hedging their bets by developing compliance plans while they try to defeat the federal rules.
For example, West Virginia — considered a leader in the lawsuit filed in Washington against EPA in October — announced later that month that it would develop a plan to comply with the EPA.
"While I believe there are significant questions regarding the legality of the Clean Power Plan, these new rules have been put into place by the federal regulatory agency," Gov. Earl Ray Tomblin said at the time. "Until a final legal decision has been made, we cannot afford to ignore them."
Other states signed onto the lawsuit appear undecided about how to proceed.
North Carolina quickly developed a proposal that ignores two of the three strategies recommended by the EPA. The plan received initial state approval in November.
"North Carolina is way ahead of the curve in terms of putting pen to paper on a rule," said Clint Woods, executive director of the Association of Air Pollution Control Agencies.
John Evans, chief deputy secretary for the Department of Environmental Quality, explained the rationale during a November meeting before a state environmental panel. He argued that the main lawsuit by the states could be drawn out by the EPA, making the state plan North Carolina's best hope to fight it in court.
"We expect the EPA to oppose being heard, and if they are successful, then ... the only chance for judicial review that we have available to us will be North Carolina's plan," he said.
Evans explained that if North Carolina submits a rule that's rejected by the EPA, the state can then take its case to the 4th U.S. Circuit Court of Appeals.
"We have an appeal right there. That might be the first challenge in the nation to the federal power plan rule," he said.
North Carolina officials argue that improving the efficiency of power plants is the only approach out of three encouraged by the Obama administration that would be legal under state and federal law. The other approaches are increasing the use of natural gas and renewable energy.
North Carolina's director of air quality, Sheila Holman, told The Associated Press this month that state officials don't think they have the authority to force power companies to use those approaches.
According to the state's own estimates, its plan would fall short of the EPA's goals for reducing carbon emissions by 2030.
State officials say they will develop a backup plan in 2016 that expands strategies for reducing emissions in case the legal efforts fail. If no plan is submitted, the EPA can impose its own rules on the state.
Conservationists with the Sierra Club and the Natural Resources Defense Council echo Woods, whose organization works with 18 states that are mostly opposed to the EPA plan, in saying they're not aware of any taking the same approach as North Carolina.
More than a dozen of the states involved in the primary legal fight with the EPA have either said explicitly they will comply or have taken steps to develop a plan. Montana Gov. Steve Bullock, for instance, said earlier this month that the state must create a compliance plan even though he doesn't think the EPA rules are fair.
Others, including New Jersey and Oklahoma, have signaled they intend to refuse to comply.
Holman said North Carolina is already a national leader in heat rates for coal-fired plants — a key measure of efficiency — making it hard to wring out further improvements. A 2002 North Carolina law that required pollution cuts beyond federal standards contributed to efficiency improvements and the shuttering of older coal-burning units.
That means North Carolina wouldn't have as hard a time complying with the federal plan as other states, said Luis Martinez, a senior attorney with the Natural Resources Defense Council.
"North Carolina is very close as a state," he said, "which makes this quixotic campaign against the Clean Power Plan even stranger."
SOURCE
The Paris Climate Talks and the INDC Gap
INDC = “Intended Nationally Determined Contribution”
The Paris climate talks are now complete, with almost 200 nations agreeing to a framework for greenhouse gas reduction that attempts to keep any warming “well below 2 °C above preindustrial levels and pursuing efforts to limit the temperature increase to 1.5 °C.” The agreement is the crowning achievement of Obama’s environmental legacy and seeks to make the United States a leader in both reducing greenhouse gases at home and providing monetary assistance to developing countries to facilitate reductions across the globe. While the negotiators have gone home, the tough task of implementation raises serious concerns about the viability of the agreement. In fact, meeting the ambitious goals set out in Paris may prove to be too expensive and too problematic.
For starters, while the president was touting the climate talks, both the House and Senate passed resolutions of disapproval for the capstone of Obama’s climate change policies, the Clean Power Plan regulations. The sweeping new regulations call for power plants to generate 32 percent fewer carbon dioxide emissions in 2030 than produced in 2005. While the congressional disapprovals won’t survive the president’s veto pen, significant legal challenges already have been launched against the regulations.
The Clean Power Plan rules are ambitious and costly. The EPA estimates an annual price tag of $8.4 billion in 2030 but others put the price at $29 billion to $39 billion per year. These are the most expensive rules released by the administration in its attempts to meet the country’s “Intended Nationally Determined Contribution” (INDC) for the global treaty to reduce greenhouse gases. The INDCs represent each nation’s assessment of how much they will reduce their greenhouse gas emissions under the United Nations Framework Convention on Climate Change. In March of this year, Secretary of State John Kerry announced that the U.S. INDC calls for a reduction of 26 percent to 28 percent by 2025.
The administration is counting on the new Clean Power regulations to cut emissions by 870 MMT (million metric tons). But even this costly regulation, with massive repercussions for the economy, American businesses, and consumers, falls well short of the targets outlined in the INDC. A recent report suggests that the U.S. can only reduce its carbon footprint by 9 percent to 19 percent—well below the president’s ambitious goal of 28 percent. And this assumes that the Clean Power Plan is fully implemented on schedule, something highly unlikely given that the rules are facing legal challenges by more than 20 states.
In fact, Stephen Eule of the U.S. Chamber of Commerce and David Bookbinder, former chief climate counsel for the Sierra Club reach similar conclusions with respect to the U.S. INDC for the global climate treaty. Hardly ideological allies, both point to the significant gap between the stated goals and reality. Even after summing up reductions from Obama’s entire major initiatives on greenhouse gases, it is clear that additional cuts will be required to meet the reductions announced by the administration.
Where will these cuts come from? In addition to the Clean Power Plan, the White House has already announced rules on everything from higher CAFE standards for cars, light trucks, and now even heavy trucks, to landfill methane, to new energy efficiency standards for appliances. But the gap remains.
With power plants and mobile sources already under the gun, the administration will have to look elsewhere for additional cuts. This means that the industrial base and agriculture—both significant contributors to greenhouse gases—may be next on the list. But in a global marketplace, additional mandates on American manufacturing will push consumer prices higher while hampering the nation’s global competitiveness. Covering that gap means significantly higher costs and a more expansive regulatory state, but, so far, the administration has been quiet about future policy options, offering no specific policies to fill the void.
Many may be celebrating the new climate agreement, but significant challenges remain. Achieving America’s announced contribution will be costly and require another round of expensive regulations, something that may prove difficult in Washington. As with most political questions, the debate ultimately comes down to money, and the latest climate agreement comes with a hefty price tag. President Obama has already implemented billions of dollars in regulations to reduce greenhouse gases. The political fortitude to continue with billions more in regulations may not exist, leaving the fate of a global agreement on climate change very much in question.
SOURCE
Greenie doom and gloom versus reality
Even after the disaster prophecies of the ludicrous Paul Ehrlich failed spectacularly, the Greenie prophecies of imminent disaster have continued to pour out. I have lost track of the number of times we were supposed to run out of food -- even while the produce sections of our supermarkets remain generously stocked. I must be naive but it always surprises me that I can buy an onion for less than 50c, sometimes much less. And, as we all know, global warming is bad for EVERYTHING. So what is the world actually like as we enter a new year? Are we marching into the ever-worsening gloom that the Greenies wish on us?
Violence dominated the headlines this year. But by many measures, humanity is in better shape than it’s ever been.
From Paris to Syria through San Bernardino to Afghanistan, the world witnessed obscene and unsufferable tragedy in 2015. That was on top of the ongoing misery of hundreds of millions who are literally stunted by poverty, living lives shortened by preventable disease and malnutrition. But for all of that, 2015 also saw continued progress toward better quality of life for the considerable majority of the planet, alongside technological breakthroughs and political agreements that suggest the good news might continue next year and beyond. Tragedy and misery are rarer than they were before 2015—and there is every reason to hope they will be even less prevalent in 2016.
To start with acts of violence in America, despite its epidemic of mass-shooting events, the country is still far safer than it was in the past. The latest FBI statistics, reported this September, suggested that the trend toward lower rates of violent crime in the United States that began in the early 1990s continued at least through 2014: There were nearly 3,000 fewer violent crimes that year than the year before and more than 600,000 fewer than in 1995—that’s a 35 percent decline over the period. The latest data from the UN suggests that this is part of a global trend—to take one category of violent crime, homicide rates have dropped by an estimated 6 percent in the countries for which data was available between 2000 and 2012.
Furthermore, terrorism, war, and murder together remain a minor cause of death worldwide. The World Health Organization estimates that 119,463 people died in incidents of “collective violence and legal intervention,” such as civil war, and 504,587 died from episodes of “interpersonal violence,” such as homicide, in 2012, the most recent year for which data is available. In the same year, according to the Global Terrorism Index, 11,133 people died in terrorist attacks—suggesting terrorism accounted for about 1.8 percent of violent deaths worldwide. And for all that terrorism deaths have increased since 2012, they remain responsible for perhaps three hundredths of one percent of global mortality. All collective and interpersonal violence together accounted for around 1.1 percent of total deaths in 2012. Rabies was responsible for three times as many deaths as terrorism that year. Stomach cancer killed more people than murder, manslaughter, and wars combined. And the good news about many of the more important causes of global mortality is that the world continued making progress against them in 2015.
Take two fellow horsemen of the apocalypse alongside war: famine and pestilence. Both were on the defensive in 2015. There were fears of drought across the Sahel causing a famine this year—especially in conflict zones such as South Sudan. While the risk of major food shortages in 2016 is high, the fear hasn’t materialized yet, at least. Famine deaths are increasingly rare and increasingly limited to the few areas of the world suffering complete state collapse. Related to that, the proportion of the world’s population that is undernourished has slipped from 19 percent to 11 percent between 1990 and today.
Or look at disease: Through the course of November 2015, only four cases of Ebola were confirmed in the three West African countries at the epicenter of the 2014-2015 outbreak. Roughly 11,315 people were either known or believed to have died in that epidemic worldwide, but compared to a 2014 Center for Disease Control forecast that, absent intervention, there might be as many as 1.4 million Ebola cases in Liberia and Sierra Leone alone by mid-January 2015, the world got off lightly, with total cases resulting from the outbreak standing at around 29,000 today. An Ebola vaccine that underwent trials in Guinea this spring proved 100 percent effective, suggesting future outbreaks of the disease should be far less deadly. The world has also seen progress toward a partially effective malaria vaccine this year.
The rollout of older vaccines over the past several years has also saved more lives than ever before this year, since vaccination protects for life, or at least multiple years. In August came news that there had not been a single case of polio detected in Africa in over 12 months, meaning the disease is now known to exist only in Pakistan and Afghanistan. What used to be a global killer, with 350,000 cases as recently as 1988, is on the verge of extinction. And just since 2000, worldwide cases of measles have dropped by more than two-thirds, saving more than 17 million lives—largely thanks to increased vaccination rates.
Meanwhile, the UN reported this year that global child mortality from all causes has more than halved since 1990. That means 6.7 million fewer kids under the age of five are dying each year compared to 1990. Nearly 7 million families avoided the pain of burying their child in 2015 who would have gone through it if the world hadn’t seen two and a half decades of historically unprecedented progress against childhood illness. 2015 also saw the lowest-ever proportion of kids out of primary school according to the UN—less than one in 10. The number of kids out of school has fallen from 100 million in 2000 to a projected 57 million in 2015.
Civil and political rights also continued their stuttering spread. While 2015 saw rights on the retreat in countries including Turkey and Thailand, the number of electoral democracies worldwide remains at a historic high according to Freedom House—at 125, up from just 69 countries in 1989 (though less than half of these are considered fully “free;” there is still a lot of progress to be made). This year, there were peaceful and democratic transitions of power in settings as diverse as Burkina Faso, Tanzania, Myanmar, and Argentina. And Saudi Arabia held local elections where, for the first time ever, women were allowed to stand as candidates and vote.
In the United States, this was the year that gay marriage became the law of the land. And once again events in America reflect a broad trend worldwide, this time toward greater acceptance. Mozambique decriminalized same-sex relationships in June, and gay marriage became legal in Ireland in November. In 2006, the International Lesbian, Gay, Bisexual, Trans and Intersex Association reported there were 92 countries with laws prohibiting sexual acts between consenting same-sex adults. This year, the number dropped to 75. Added to the trend of growing sexual and reproductive freedom worldwide, China finally abandoned its one-child policy in 2015.
So the world is better-educated, better-fed, healthier, freer, and more tolerant—and it looks set to get richer, too. In October, the IMF forecast 4.0 percent growth for emerging and developing countries for 2015—slower than the 7-8 percent that they managed through much of the last 15 years but nonetheless considerably ahead of population growth. The World Bank declared in September that, for the first time ever, less than 10 percent of the global population lived in extreme poverty, on less than $1.90 per day. That is down from 37 percent as recently as 1990. There are a lot of reasons to think the poverty measures the World Bank creates are flawed. That said, the decline certainly reflects an underlying reality: Many of the poorest countries in the world, and many of the poorest people in them, have seen dramatic income gains over the last few years.
Developing countries and the industrialized world alike also saw improved prospects thanks to continued support for globalization. The agreement on the Trans-Pacific Partnership, for all of its myriad drawbacks, demonstrated that some of the world’s largest economies remain committed to open trade.
Working together, humanity can do even better over the next 15 years. The combination of that progress with that potential is why 2015 was the best year in history for the average human being to be alive—and why 2016 will almost certainly be even better
SOURCE
***************************************
For more postings from me, see DISSECTING LEFTISM, TONGUE-TIED, EDUCATION WATCH INTERNATIONAL, POLITICAL CORRECTNESS WATCH, FOOD & HEALTH SKEPTIC and AUSTRALIAN POLITICS. Home Pages are here or here or here. Email me (John Ray) here.
Preserving the graphics: Most graphics on this site are hotlinked from elsewhere. But hotlinked graphics sometimes have only a short life -- as little as a week in some cases. After that they no longer come up. From January 2011 on, therefore, I have posted a monthly copy of everything on this blog to a separate site where I can host text and graphics together -- which should make the graphics available even if they are no longer coming up on this site. See here or here
*****************************************


 Jim Hansen and his twin


No comments:
Post a Comment