
Wind power paranoia has bypassed science logic and is well and truly in the realm of mysticism
Let me state categorically that, as a physicist, I am in favour of wind power that is genuinely economically viable. The problem is that large-scale wind power fed into a national grid is just not viable – either economically or practically – from an engineering stand point.
The dream of some enthusiasts that there is some major technological leap just waiting in the wings that will make wind power viable is extremely unlikely to take place. The total energy in any wind stream is measurable, and there is no known quantum leap waiting for a solution that could produce considerably more wind energy than at present.
The extreme language and wild claims concerning the potential glories of wind power are becoming more and more exotic and are rapidly being blown further away from reality by the wind of reason. We really need a wind of change to blow now to bring debate back to sound logical discourse on the real strengths and weaknesses of wind power.
I have been reading documents on wind energy from a variety of sources and one sees a spectrum of highly optimistic statements, such as the one here in South Africa from the wind lobby, which says it is striving for 20% of national demand to be met by wind power by 2025. Okay, there is nothing wrong in an optimistic dream.
However, in referring to the intro- duction of more wind power, the statement goes on to say: “It will involve close interaction between the private and public sectors to ensure technical parameters and electricity grid designs are appropriate to facilitate it.”
What this statement actually says is: there are severe technical problems in integrating a highly variable energy source into the grid and somebody will have to overcome these problems that we know exist, but we do not want to mention them.
A spokesperson of the South African Wind Energy Association was quoted in the media as saying: “Contrary to what most believe, a 30 000 MW wind energy plant would have an average daily minimum power output of 7 000 MW and would displace 6 000 MW of conventional coal or nuclear power baseload.”
This statement is significant for a few reasons. Firstly, it is irresponsible fantasy. Secondly, it does admit that a ‘plant’ of 30 000 MW does not produce 30 000 MW but only an ‘average’ of 7 000 MW. Take careful note of the word ‘average’. This word means that, in practice, the ‘plant’ could produce any output from zero to 30 000 MW, depending on if and when the wind blows. On ‘average’, they say, one should get 7 000 MW ‘daily’.
But what does that mean? How can one use the terms ‘average’ and ‘daily’ together. Think about it. The most common error committed unknowingly by the media, and knowingly by the wind proponents, is that a quoted figure for installed capacity for wind power is not the amount you get. Wind power systems are fundamentally designed to produce about 25% of their installed capacity, so one designs to get about 7 000 MW out of 30 000 MW of installed capacity. Frequently, the operating wind systems do not even deliver the designed 25% – at times half of this or less. In contrast, with nuclear power, one would get more than 25 000 MW out of an installed capacity of 30 000 MW and one would get it all the time, not only ‘on average’ when the wind blows.
Further, to refer to ‘a plant’ of 30 000 MW as if such a huge capacity would be built in one ‘plant’ is just crazy. Actually, it is irresponsible to use such language.
A capacity figure of 30 000 MW would be arrived at by adding together many wind farms which would be placed very far apart. So, the wind patterns would be very different. The so-called ‘average’ wind output of 7 000 MW could actually appear anywhere over a very wide area, hundreds or, perhaps, thousands of kilometres apart. This is the type of situation that gives rise to technical problems in the grid. You cannot just push significant pulses of electricity into the grid at widely divergent places at widely differing times – depending on when and where the wind blows. Something will blow (pun intended).
To say that this claimed 7 000 MW would replace 6 000 MW of nuclear or coal power is just foolish.
I recently received a comprehensive wind power report from the UK. This report contains the real results of UK wind power facilities. It is very revealing. For example, it quotes, in detail, the significant number of days during the past year when the entire system produced essentially no output at all. What this tells one is that the entire installed wind capacity needs a backup consisting of some really reliable source like coal or nuclear.
What then is the point of large-scale wind power if one needs a second source in reserve? I am not aware of any place in the world where the installation of large-scale wind energy has actually resulted in the decommissioning of other significant power sources.
It is time that the fantasy of producing large-scale economic wind energy reliably was put aside and a sensible realism emerged. Such a realism would examine deploying existing wind technology in isolated standalone systems, which are genuinely economic and which use the intermittent nature of the wind as a strength, and do not hide this inherent weakness with smoke and mirrors. There are thousands of places on the planet that really need such standalone energy systems.
SOURCE
British Met Office Climate Forecasts: Always Wrong But Never In Doubt
When it comes to testing a climate model, the future is more important than the past. You can take your model and adjust its various parameters to fit observations already made, but the crucial test is how well that model matches the future. This involves making a prediction, but, as they say, prediction is difficult, especially about the future.
The important thing about a prediction is that once made you don’t modify it or start making excuses. It is prediction though that sets a model apart from mere curve fitting and tells you if your model is in touch with reality and is not just matching wriggles on graphs. The problem with computer models of the climate is that ideally several decades are needed to see if they are any good. This is tricky to fit into an academic life and frustrating for all concerned, but there are other ways.
Shorter-term predictions will contain more noise but if the model captures accurately the putatively increasing man-made warming signal in the data it should be possible to say something statistically about its presence. In the past few years the Met Office has been doing exactly that. What they have also been displaying is a public lack of self-evaluation, and hoping we have short memories.
In 2007 it became obvious that annual global temperatures were not increasing in the past few year, and a few people said so in public what scientists were talking about in private hoping it wouldn’t get out.
With A Vengeance
In August of 2007 the UK Met Office released a study that predicted that global warming will set in with a vengeance after 2009, after they implicitly acknowledged the temporary warming standstill, with at least half of the five following years expected to be hotter than 1998, which was then, and is still the warmest year on record.
The Guardian said:
British scientists are predicting a succession of record-breaking high temperatures in the most detailed forecast of global warming's impact on weather around the world.
Powerful computer simulations used to create the world's first global warming forecast suggests temperature rises will stall in the next two years, before rising sharply at the end of the decade.
From 2010, they warn, every year has at least a 50% chance of exceeding the record year of 1998 when average global temperatures reached 14.54C.
Reporters were told that in order to make such a prediction, researchers at the Met Office had made a computer model that takes into account such natural phenomena as the El Nino pattern in the Pacific Ocean, and other fluctuations in ocean circulation and heat content.
The Telegraph said:
This is the prediction of the first computer model of the global climate designed to make forecasts over a timescale of around a decade, developed by scientists at the Met Office.
"This is a very valuable step forward," Science magazine was told by meteorologist Rowan Sutton of the University of Reading. "It's precisely on the decadal time scale and on regional scales that natural variability and anthropogenic (man made) effects have comparable magnitudes."
The climate model was described in Science. It states, “…at least half of the years after 2009 predicted to exceed the warmest year currently on record.”
How well did this computer model do by its own test?
We are now two years into their five year prediction, and as yet none of them has been anywhere near the temperature of 1998. This means that, if the prediction is correct, then all three of the subsequent years, including 2014, must be hotter than 1998. Looking at the data I don’t think this is likely to happen.
In the event of the prediction’s failure it would be disingenuous to say: oh well, there were more La Nina cooling events than we thought, but that the model is sound. Such events were incorporated into the model. Strictly speaking if it fails its self-appointed test then the model is unsound, it has failed its crucial test at the least with its specific input parameters.
The problem is however that the Met Office keeps moving the goalposts.
After the 2007 prediction, and with the addition of only one annual more temperature datapoint (that for 2008 which was statistically identical to the previous years since 2001), in 2009 Prof Phil Jones of the University of East Anglia wrote in an email:
Tim, Chris, I hope you’re not right about the lack of warming lasting till about 2020. I'd rather hoped to see the earlier Met Office press release with Doug's paper that said something like - half the years to 2014 would exceed the warmest year currently on record, 1998!
Then at the end of 2009 the Met Office admitted that 2009 was not a record breaker and was in fact near the “lower end of expectations.”
The problem was, of course, the cooling effect of a La Nina, which even though incorporated into the models, had compensated for the underlying warming. As Phil Jones put it, the presence of La Nina during the last year partially masked this underlying rate.
Phenomena such as El Nino and La Nina have a significant influence on global surface temperature, said Dr. Chris Folland of the Met Office Hadley Centre. Further warming to record levels is likely once a moderate El Nino develops. The transition from a La Nina effect to an El Nino one is expected late next year.
Of course, even in the presence of no warming seen in the past decade a strong El Nino might boost temperatures to a record level, even though that would say more about the El Nino’s starting point and not the underlying decadal temperature increase. Such crucial scientific specifics were however lost, at least in public. So the hopes were high that 2010 would be a record year.
Climate could warm to record levels in 2010, the Met Office said:
The latest forecast from our climate scientists, shows the global temperature is forecast to be almost 0.6 °C above the 1961-90 long-term average. This means that it is more likely than not that 2010 will be the warmest year in the instrumental record, beating the previous record year which was 1998.
It wasn’t. The forecast was a spectacular failure.
Despite a strong El Nino it had a temperature anomaly of 0.470 (with respect to 1961 – 90 average) making it the third warmest year though when the errors are looked at it is in undistinguished member of the post-2001 standstill.
In another rewriting of history Prof Phil Jones said that due to natural variability we do not expect to see each year warmer than the last, but the long-term trend is clear.
The problem is that no year has been warmer than the last!
So, forever hopeful, onto 2011. If the model is correct it must surely be the warmest, after all if the model is right a new warmest year ever must be along any year soon.
The Met Office said that for 2011 they were expecting another very warm year, with a global anomaly forecast of +0.44C above the 1961-1990 average. That would make 2011 the equal 6th warmest year on record.
It isn’t. Whilst we wait for the November and December data 2011 has a temperature anomaly of 0.356 and is the 11th warmest year. Again the Met Office forecast was way off.
Remember the 2007 prediction (half of the post 2009 years would be warmer than 1998). Curiously, at the beginning of 2011 the Met Office revised their prediction and said they expect that 'half the years between 2010 and 2015 to be hotter than the hottest year on record'.
The goalposts have moved! 2009 – 2014 has become 2010 – 2015. The cardinal rule in making predictions is not to fudge them, and be honest about the results before making a new prediction with a revised timescale.
If the Met Office climate model is correct then there should be more than 50% of the years 2010 – 2015 exceeding the 1998 record. In the Times of 29 Nov 2011 Peter Stott of the Met Office changed the goalposts again, saying that they stood by their previous prediction that half the years in this decade would be warmer globally than 1998, the warmest year to date.
None of the Met Office forecasts have been correct. The global annual average temperature has to increase soon or else the goalposts will have to be moved again. At what stage does one admit the predictions were wrong?
The latest news is that a second cooling La Nina is brewing in the later part of 2011 and may extend into 2012. Given that, I wonder what the predictions for 2012 will be?
SOURCE
Era of energy subsidies is over
American consumers, not Congress, should choose best power sources
Bill Clinton famously said, “The era of big government is over.” Well, it didn’t work out that way. But something truly remarkable is happening in our national conversation about energy subsidies: outrage, mounting opposition and, we hope, a swift end. This would be great news for taxpayers and consumers.
Subsidy folly has been bipartisan and commonplace. For the past three decades, both parties have intervened in the energy industry. In 1978, a Democrat-controlled Congress and President Carter created an investment tax credit for solar, wind and other renewable energy sources. In 1992, a Democrat-controlled Congress and Republican President George H.W. Bush passed the production tax credit for electricity produced from wind and biomass. Then in 2005, a Republican-controlled Congress and President George W. Bush passed the Energy Policy Act of 2005, which included massive tax subsidies for seemingly every energy source under the sun, including alternative vehicles, advanced nuclear power and, of course, solar power. The latter legislation created the infamous Department of Energy loan-guarantee programs that produced the ongoing Solyndra scandal.
After three decades, what have we learned?
* Energy subsidies distort the free market by funneling billions in taxpayer dollars to politically favored energy sources and technologies, preventing market prices from signaling the optimal source for particular energy uses.
* Subsidizing energy sectors drains the federal treasury and forces the consumption of higher-cost energy sources.
* Politically allocated capital typically flows to politically connected companies or to large companies that could develop innovative technologies on their own dime. The $535 million Solyndra scandal has reinforced all of these lessons and helped shine a light on the energy-subsidy debate, exposing those who maintain government is the solution to our energy needs.
The good news is that with the support of the American people, politicians now are speaking the truth. At a recent Republican presidential forum, the candidates were in near-unanimous agreement that it is time to end the federal government’s role and allow the free market to bring our nation the next great energy source. Texas Gov. Rick Perry said, “I do not think it is the federal government’s business to be picking winners and losers, frankly, in any of our energy sources.” Rep. Michele Bachmann had similar remarks: “I want to see a [level] federal playing field. We’ve seen what a disaster it is when the federal government picks winners and losers.” In his economic plan, former Massachusetts Gov. Mitt Romney said government “should not be in the business of steering investment toward particular politically favored approaches.” This is progress. Just four years ago, almost every candidate in Iowa was afraid to say that subsidizing politically favored energy technologies had been an enormous policy failure.
Given the shift in the debate, the time to end subsidies is now. This month we introduced the Energy Freedom and Economic Prosperity Act, H.R. 3308, which has garnered support from such conservative organizations as Americans for Prosperity, Americans for Tax Reform, Club for Growth, Council for Citizens Against Government Waste, Freedom Action, Heritage Action for America, National Taxpayers Union and Taxpayers for Common Sense. H.R. 3308 would eliminate all energy tax credits, each of which is nothing more than a taxpayer handout to politically favored industries or companies. From solar to wind, from geothermal to biomass and from ethanol to hydrogen, they all must go. It is equal opportunity - not one single solitary tax credit would survive this bill. The proposal then would use the savings realized from the repeal of these tax credits to lower the corporate tax rate. This is a perfect model for tax reform - close out politically allocated tax favors and loopholes and lower taxes on every business that competes in America.
While we are gaining broad public support to end these energy tax credits, the takers of government largesse seldom go quietly. The pro-subsidy lobby pushes to extend its giveaway from Uncle Sam, seeking to extend the production-tax-credit subsidies for wind, biomass and geothermal energy every four years. This is the umpteenth-and-never-final request for “just four more years.” But a few more years will just lead to a few more years after that. Even before we introduced the legislation that for the first time would provide zero tax credits to any energy source, the American Wind Energy Association howled that Rep. Mike Pompeo “seems to misunderstand how a key federal tax incentive has built a thriving American wind manufacturing sector and tens of thousands of American jobs.” Well, we both understand perfectly - handouts are hard to give up.
After three decades, the tide on energy subsidies has turned. Our nation has squandered hundreds of billions of dollars with these tax credits and has little to show for it. We hold no ill will to any of these energy sources that receive tax credits - some or all of them may well become the next great American energy technologies. But having dozens of energy handouts leads companies to spend resources lobbying Washington rather than tinkering in their garages and labs. Indeed, we are counting on one of these alternatives to succeed. We just know that we have no idea, nor do any of our peers in Congress, which one consumers ultimately will demand. The winner must be determined the old-fashioned way: through hard work, innovation, American moxie and superior skills engaged in competition.
Let’s put a different twist on the old saying “not invented here” by acknowledging that energy technology never has been invented here - on the Potomac - and do away with energy subsidies once and for all.
SOURCE
Long-term sea-level rise negligible
This week's Spectator cover star Nils-Axel Mörner brings some good news to a world otherwise mired in misery: sea levels are not rising dangerously – and haven't been for at least 300 years. To many readers this may come as a surprise. After all, are not rising sea levels – caused, we are given to understand, by melting glaciers and shrinking polar ice – one of the main planks of the IPCC's argument that we need to act now to 'combat climate change'?
But where the IPCC's sea level figures are based on computer 'projections', questionable measurements and arbitrary adjustments, Mörner's are based on extensive field observations. His most recent trip to Goa in India last month – just like his previous expeditions to Bangladesh and the Maldives – has only served to confirm his long-held view that reports of the world's imminent inundation have been greatly exaggerated for ends that have more to do with political activism than science.
Mörner's views have not endeared him to environmental campaigners or the IPCC establishment. A few years ago, when I mentioned his name in a public debate with George Monbiot, I vividly remember an audible hissing from sections of the audience as if I'd invoked the equivalent of Lord Voldemort.
The problem for Mörner's detractors is that, eccentric and outspoken Danish count though he no doubt is, he also happens to be the world's pre-eminent expert on sea levels. Besides being responsible for dozens of peer-reviewed papers on the subject, he was also chairman of INQUA Commission on Sea Level Changes and Coastal Evolution. This means that his findings can not easily be dismissed as those of a raving 'climate change denier'.
I have heard Mörner speak many times and his position is not nearly as controversial as it is sometimes made out to be by his detractors. His view is simple: 'If sea levels really are rising and islands like Tuvalu and the Maldives are in imminent danger of drowning, where is the physical evidence to support it?' So far there is none. It is those who claim otherwise who are the true 'deniers'.
SOURCE
Reports of Australian long-term sea-level data being suppressed by Left-appointed bureaucrats
The constant Warmist attempts to block public access to basic data tells its own story. What have they got to hide? Below is one answer
SENIOR bureaucrats in the state government's environment department have routinely stopped publishing scientific papers which challenge the federal government's claims of sea level rises threatening Australia's coastline, a former senior public servant said yesterday.
Doug Lord helped prepare six scientific papers which examined 120 years of tidal data from a gauge at Fort Denison in Sydney Harbour. The tide data revealed sea levels were rising at a rate of about 1mm a year or less - and the rise was not accelerating but was constant.
"The tidal data we found would mean sea levels would rise by about 100mm by the end of the century," Mr Lord said yesterday. "However the (federal) government benchmark which drives their climate change policy is that sea levels are expected to rise by 900mm by the end of the century and the rate of rise is accelerating."
Mr Lord, who has 35 years experience in coastal engineering, said senior bureaucrats within the then Department of Environment Climate Change and Water had rejected or stopped publication of five papers between late 2009 and September this year.
"This was very thorough research, peer reviewed and getting the highest ranking from various people, and one of the papers got a nine out of 10 for the quality of the work," he said.
"You have to ask yourself why they were rejected, considering they had been peer reviewed, and the Fort Denison tide data is among the longest continuous data of its type available in the world. "There's never been a sensible explanation of why they have stopped these papers."
Mr Lord left government work in 2010 but continued to co-author the tidal data papers with experts still working for the state government.
The latest incident came in September when organisers of the Coasts and Ports 2011 Conference in Perth accepted one of the studies, only to have senior OEH bureaucrats tell them it had to be withdrawn. "They were able to do this because my co-author of this study, and the co-authors of the other rejected studies done after I left government work, still work for the government," Mr Lord said.
"As far as I am aware the minister has not been made aware by her department that this has been happening."
SOURCE
Federally Funded Arctic Stupidity
Federal report: Arctic much worse since 2006
By SETH BORENSTEIN | AP – 5 hrs ago
WASHINGTON (AP) — Federal officials say the Arctic region has changed dramatically in the past five years — for the worse.
It’s melting at a near record pace, and it’s darkening and absorbing too much of the sun’s heat.
Right. NSIDC reported in their last Arctic Sea Ice News that autumn freeze up was 40% faster than normal. It is pitch black in the Arctic, and ice extent is essentially identical to 1996.
The Arctic acts as Earth’s refrigerator, cooling the planet. What’s happening, scientists said, is like someone pushing the fridge’s thermostat much too high.
DMI reports that temperatures near the pole have been close to the long term mean for the past seven months.
“It’s not cooling as well as it used to,” Richter-Menge said.
The dramatic changes are from both man-made global warming and recent localized weather shifts, which were on top of the longer term warming trend, scientists said.
Right. Walt Meier at NSIDC says that it was warmer in Greenland 70 years ago.
The report, written by 121 scientists from around the world, said statistics point to a shift in the Arctic health in 2006. That was right before 2007, when a mix of weather conditions and changing climate led to a record loss of sea ice, from which the region has never recovered. This summer’s sea ice melt was the second worst on record, a tad behind 2007.
In other words, the trend since 2007 is upwards.
“We’ve got a new normal,” said co-author Don Perovich, a geophysicist at the Army Corps of Engineers Cold Research and Engineering Lab. “Whether it’s a tipping point and we’ll never recover, who’s to say?”
We do have a new normal. Climate scientists constantly making completely unsupportable claims while climate conferences are happening in exotic resorts. These people are hoping to keep the money flowing in and will say anything to maintain their lifestyle.
The report highlighted statistics to show an Arctic undergoing change:
—A NASA satellite found that 430 billion metric tons of ice melted in Greenland from 2010 to 2011, and the melting is accelerating. Since 2000, Greenland’s 39 widest glaciers shrunk by nearly 530 square miles, about the equivalent of 22 Manhattans.
Satellites are pieces of metal. They don’t find anything. People on the other hand often misinterpret data collected from equipment on satellites. Sea level has dropped dramatically since the start of 2010. This tells us that the net balance of ice is probably positive, not negative. It also tells us that the people making these claims are probably incompetent.
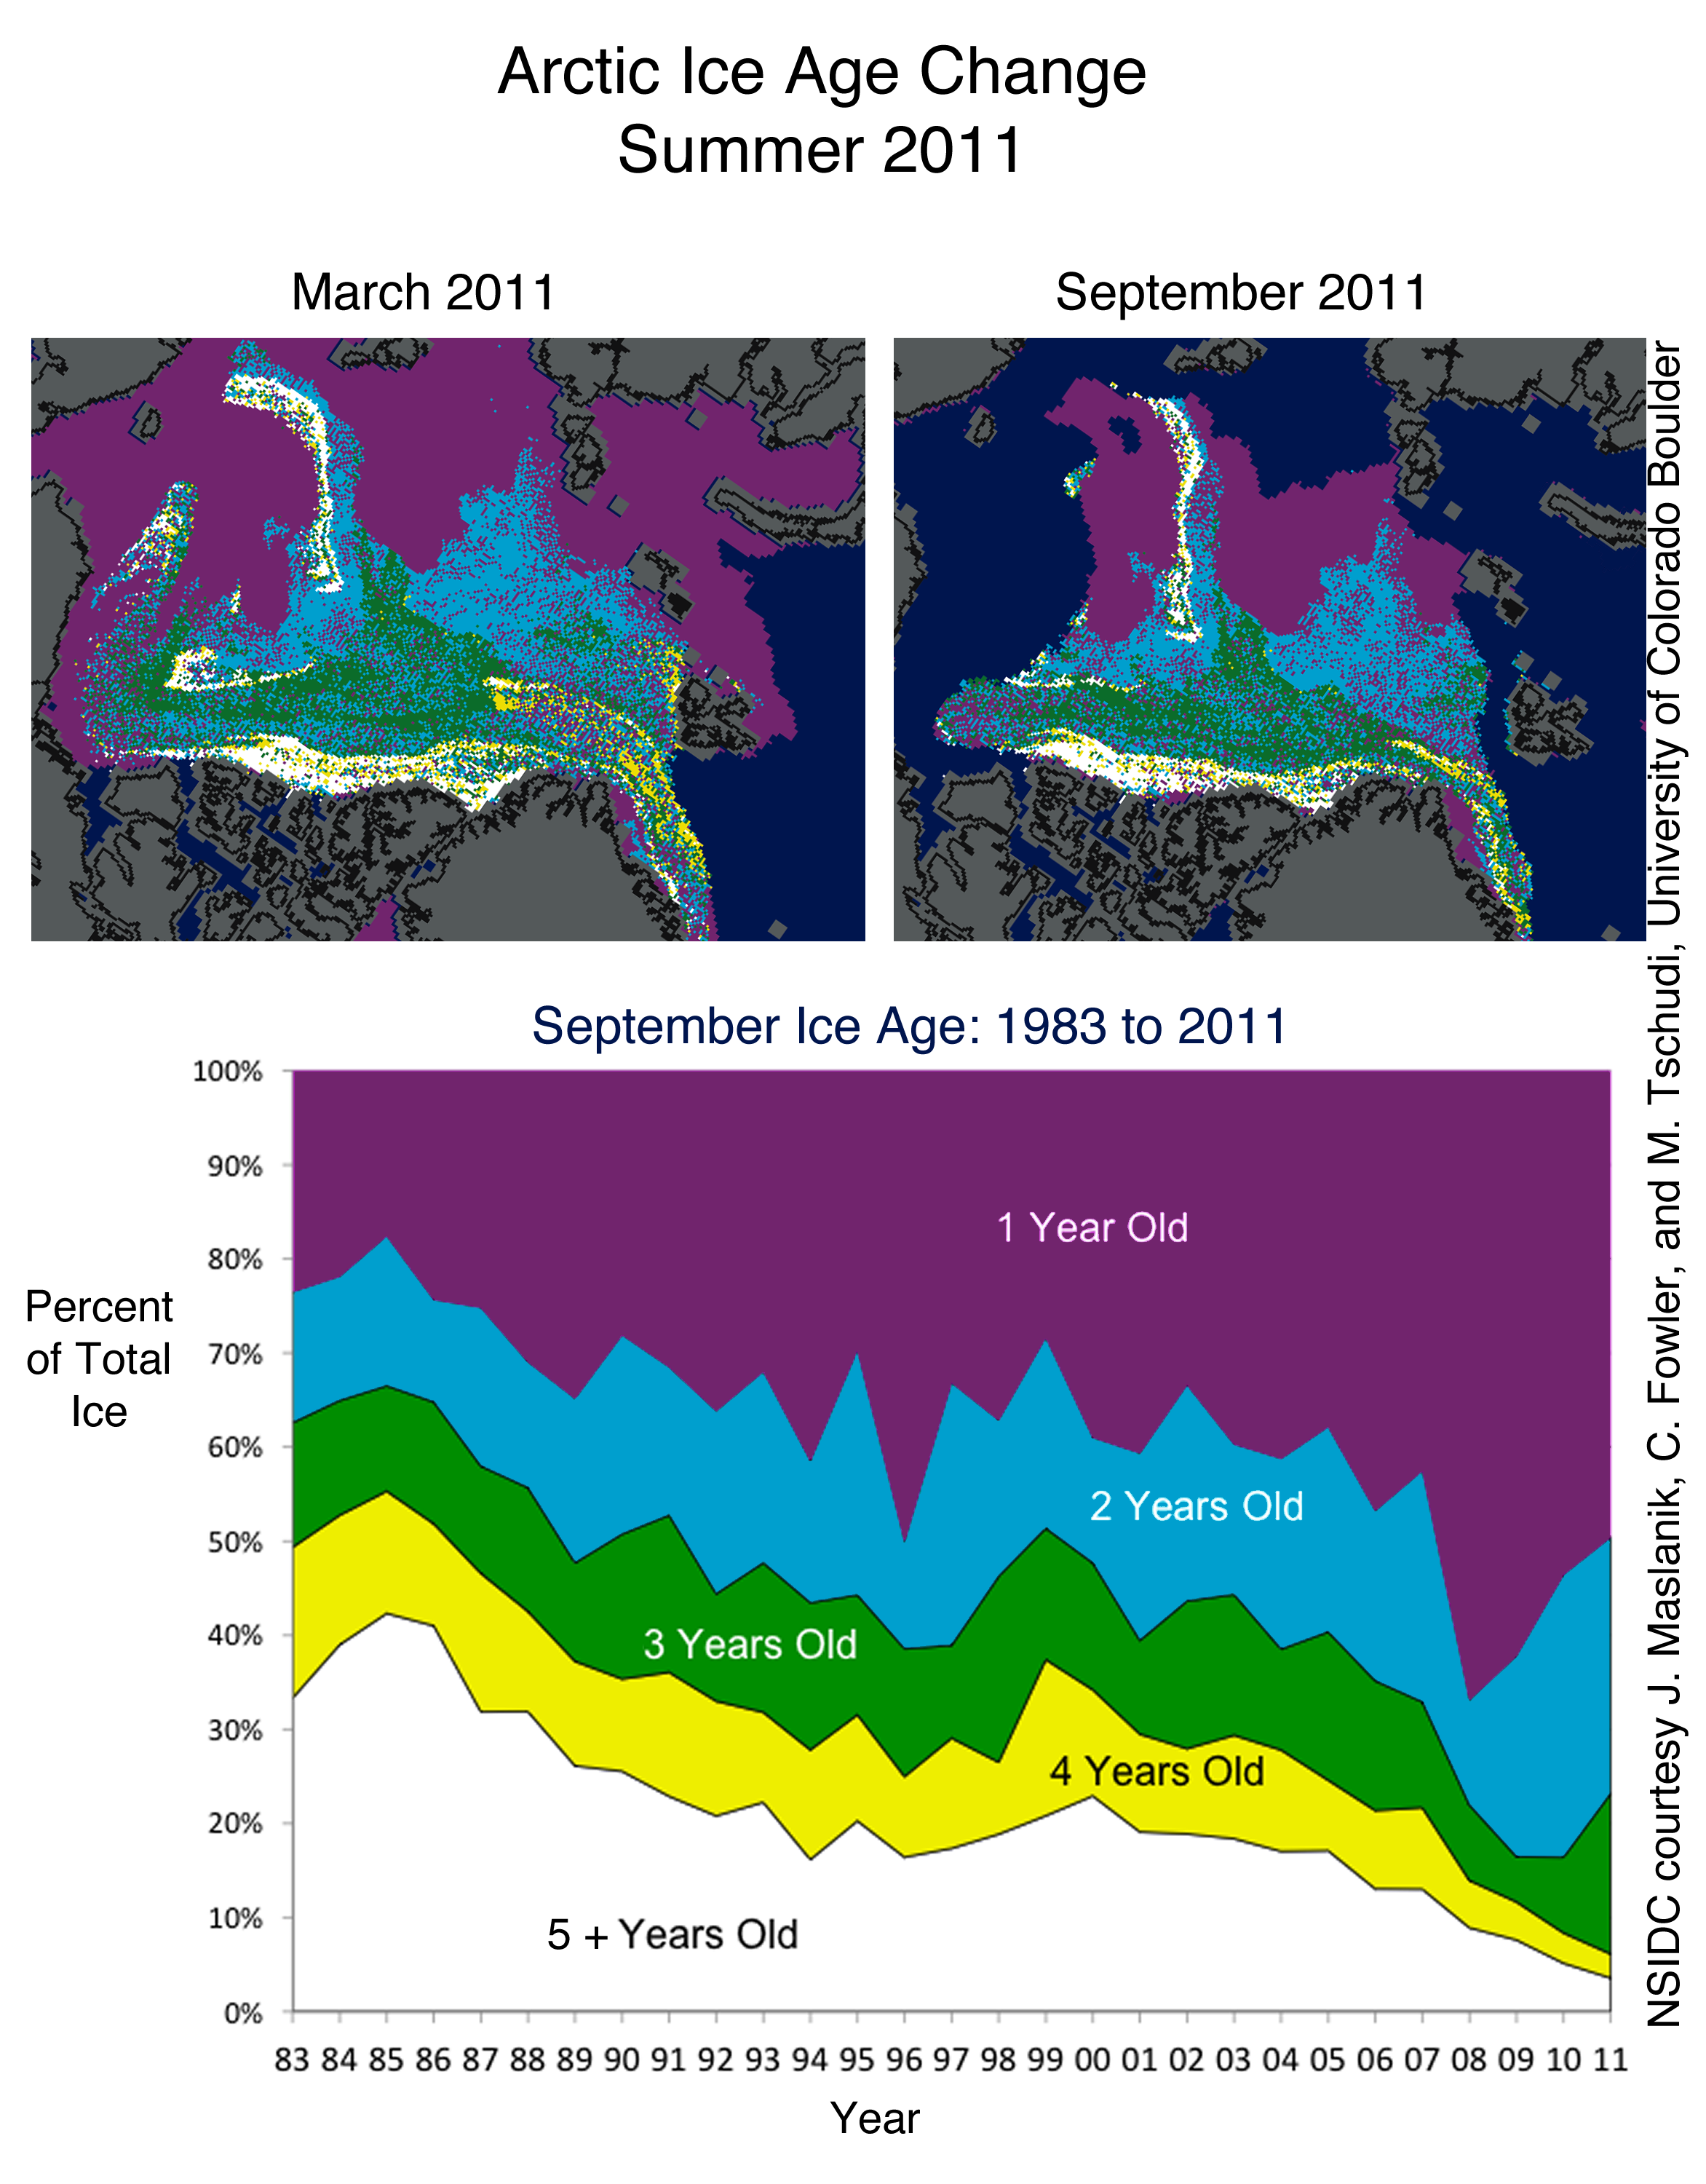
Multi-year ice [particularly 2-year ice] has increased by almost 50% over the last three years. The ice is recovering, but they choose to ignore it.

http://nsidc.org/images/arcticseaicenews/20111004_Figure6.png
SOURCE
Disagreement with Warmism merits firing
Climategate II -- Email 3946:
I responded to [Chris Landsea's] earlier message in a fairly low key fashion. I think he has behaved irresponsibly and ought to be fired by NOAA for not have an open enough mind to even consider that climate change might be affecting hurricanes. I am quickly becoming outraged by this and I hope it backfires on him!!!!
Kevin [Trenberth]
SOURCE
***************************************
For more postings from me, see DISSECTING LEFTISM, TONGUE-TIED, EDUCATION WATCH INTERNATIONAL, POLITICAL CORRECTNESS WATCH, FOOD & HEALTH SKEPTIC, GUN WATCH, AUSTRALIAN POLITICS, IMMIGRATION WATCH INTERNATIONAL and EYE ON BRITAIN. My Home Pages are here or here or here. Email me (John Ray) here. For readers in China or for times when blogger.com is playing up, there are mirrors of this site here and here
*****************************************


 Jim Hansen and his twin


No comments:
Post a Comment