
A strange "refutation". Nobody denies that there was a small warming recorded for the Northern hemisphere in the second half of the 20th century. The question is what caused that recorded warming. The sun, heat-island effects, other cyclic factors or random factors? Although they are by definition unlikely, "runs" in random sequences are not at all unknown. Such runs are one of the main reasons why gamblers stay hooked. And the big question is the reliability of the aggregated ground-based thermometer measurements. I append below two emailed comments on that from Lord Monckton and Vincent Gray
Between 1880 and 2006 the average global annual temperature was about 15øC. However, in the years after 1990 the frequency of years when this average value was exceeded increased. The GKSS Research Centre asks: is it an accident that the warmest 13 years were observed after 1990, or does this increased frequency indicate an external influence?
With the help of the so called ,Monte-Carlo-Simulation" the coastal researchers Dr. Eduardo Zorita and Professor Hans von Storch at the GKSS-Research Centre together with Professor Thomas Stocker from the University of Bern estimated that it is extremely unlikely that the frequency of warm record years after 1990 could be an accident and concluded that it is rather influenced by a external driver.
The fact that the 13 warmest years since 1880 could have accured by accident after 1990 corresponds to a likelihood of no more than 1:10 000. These likelihood can be illustrated by using the game of chance "heads or tails": the likelihood is the same as 14 heads in a row.
,In order to understand and statistically analyse the climate system and its interaction between the ocean, land, atmosphere and human activity, the comparison with a game of chance is no longer sufficient. The natural sequence of warm and cold years no longer functions according to the simple principle of ,zero or one", explains the GKSS scientist Dr. Eduardo Zorita about the challenges of his calculations, because the climate system possesses some inertia.
An example: After a warm year milder years tend to follow, since the oceans have stored some heat. This natural inertia must also be included in the calculations. "Our study is pure statistical nature and can not attribute the increase of warm years to individual factors, but is in full agreement with the results of the IPCC that the increased emission of green house gases is mainly responsible for the most recent global warming", says Zorita in summary.
Source
Monckton:
As Joe d'Aleo has pointed out, 1990 was the year when the former Soviet Union fell apart, taking very large numbers of rural stations out of the temperature datasets. Given the way the data are averaged to produce a single global anomaly each month or year, the effect of removing large numbers of rural stations with small temperature increases was to cause a sudden and startling jump in temperatures in 1990. Anthony Watts' work on temperature stations has shown what a nonsense they are, and Ross McKitrick has shown that all of the datasets, even the satellite ones, are showing temperature increase patterns that correlate in a statistically significant way with economic development patterns [Evidence of heat output direct from human activities, not of a greenhouse effect]. So what is really being measured is the direct output of heat by the exothermic activities of humankind, rather than the probably-negligible radiative forcing from greenhouse-gas enrichment.
My purpose in reviewing all this is to ask whether anyone knows enough about the compilation of the temperature records to say whether the heat-island effects are subtracted, in an attempt to restore the readings that might have occurred if the region around the station had not become urbanized, or redistributed, so as to reflect the fact that all that direct heat output - amplified by net-positive temperature feedbacks just as radiatively-forced temperature increases would be - is actually going into the atmosphere. I did an energy budget calculation based on this exothermic activity once, and got quite a surprise: it accounted for 0.1-0.2 C of the increase in global temperatures since 1980 - not too far out of line with McKitrick's finding. If I'm right about this, then the world is addressing the wrong problem, and all those windmills will actually be adding to "global warming", as well as killing off millions of rare birds.
Gray
I have made a particular study of this subject but am not able to give a complete answer. I deal with some of it in my "Global Scam" paper where I show that the main papers quoted by the IPCC justifying a belief that the urban effect is negligible are fraudulent. I deduce from this that they either make no adjustment at present or a very small one. On the other hand in the Brohan et al paper, which is the last comprehensive one, they claim to apply the "homogenization" technique of the US GHCN who have a whole set of corrections, most of which could not possibly apply anywhere else but the USA, and which Peterson fraudulently claimed did not include an urbanization correction. The largest correction he found was the "Time of Observation Bias" which arises because they measure the maximum and minimum once a day at a different time in different places, and sometimes in the same place, referring to a different 24 hours for each.
On the other hand there have been places that measure temperatures several times a day for some years,. Canada for one, and there are now many which measure continuously by an automatic system, If they want to be compatible with the past they must surely forget everything except the maximum and minimum, but do they?
There has been no warming in New Zealand since 1950 and if you believe Christchurch, the hottest year was 1917. The "corrected" temperature for the USA shows that the maximum was 1934.
Many fairly reliable local records show no overall warming. The record I was given from China, claimed to have been "homogenized" and also shows no overall warming. The puzzling feature of their graph is that it includes a subset from Hadley that agrees with theirs. So the "warming" of Hadley may result exclusively from the unreliable records from the major part of the world which cannot have the benefits of "homogenization"; including of course, the Russians where they closed down urban stations,and stopped the wages of the operatives so they were reluctant to get up and make the readings on a cold day.
The publicity that Roger Pielke Sr and his meteorologists and Antony Watts and his Google Earth ground level, about the inadequacy of siting of met instruments have put them on their mettle. They now actually let us see photographs of their sites. This may be one reason why the global temperature records from the surface and from the satellites seem to be mysteriously merging to give the same answers. Stauffer et al are merely carrying out a last ditch stand before everybody wakes up to what has been going on.
Trying to find out the exact circumstances under which meteorological measurements were carried out in obscure parts of the world over the past 100 years is likely to be a bit futile. All we know is they seem to have got their act together.
The nonsense never ceases
IF you want to help save the planet from carbon carnage, cut your Google searches, scientists say. Performing two Google searches from a desktop computer can generate about the same amount of carbon dioxide as boiling a kettle for a cup of tea, according to new research, The Australian reports. While millions of people tap into Google without a thought for the environment, a typical search generates about 7g of CO2. Boiling a kettle generates about 15g. "Google operates huge data centres around the world that consume a great deal of power," said Alex Wissner-Gross, a Harvard University physicist whose research on the environmental impact of computing is due out soon. "A Google search has a definite environmental impact."
Google is secretive about its energy consumption and carbon footprint. It also refuses to divulge the locations of its dozens of data centres. However, with more than 200m internet searches estimated globally every day, the level of electricity consumption and greenhouse gas emissions caused by computers and the internet is provoking concern.
A recent report by Gartner, the industry analysts, said the global IT industry generated as much greenhouse gas as the world's airlines - about 2 per cent of global CO2 emissions. "Data centres are among the most energy-intensive facilities imaginable," said Evan Mills, a scientist at the Lawrence Berkeley National Laboratory in California. Banks of servers storing billions of web pages require power both to run and cool them.
Though Google says it is in the forefront of green computing, its search engine generates high levels of CO2 because of the way it operates. When you type in a Google search for, say, "energy saving tips", your request doesn't go to just one server. It goes to several competing against each other. It may even be sent to servers thousands of miles apart. Google's infrastructure sends you data from whichever produces the answer fastest. The system minimises delays but raises energy consumption....
Google Australia told News.com.au it has built the most energy-efficient data centres in the world. "Our data centres use considerably less energy for the servers themselves, and much less energy for cooling, than a typical data centre. As a result, the energy used per Google search is minimal. In fact, in the time it takes to do a Google search, your own personal computer will use more energy than we will use to answer your query.
Source
More skepticism from Russia
The author below -- Gregory F. Fegel -- appears to be some sort of Leftist from Oregon but the fact that he had to go to Russia to get his article published reflects the widespread skepticism about global warming in Russia. They are more worried about imminent cooling, for reasons that are perhaps obvious. At any event, the article below is a reasonable summary of the historical evidence
The earth is now on the brink of entering another Ice Age, according to a large and compelling body of evidence from within the field of climate science. Many sources of data which provide our knowledge base of long-term climate change indicate that the warm, twelve thousand year-long Holocene period will rather soon be coming to an end, and then the earth will return to Ice Age conditions for the next 100,000 years.
Ice cores, ocean sediment cores, the geologic record, and studies of ancient plant and animal populations all demonstrate a regular cyclic pattern of Ice Age glacial maximums which each last about 100,000 years, separated by intervening warm interglacials, each lasting about 12,000 years.
Most of the long-term climate data collected from various sources also shows a strong correlation with the three astronomical cycles which are together known as the Milankovich cycles. The three Milankovich cycles include the tilt of the earth, which varies over a 41,000 year period; the shape of the earth's orbit, which changes over a period of 100,000 years; and the Precession of the Equinoxes, also known as the earth's `wobble', which gradually rotates the direction of the earth's axis over a period of 26,000 years. According to the Milankovich theory of Ice Age causation, these three astronomical cycles, each of which effects the amount of solar radiation which reaches the earth, act together to produce the cycle of cold Ice Age maximums and warm interglacials.
Elements of the astronomical theory of Ice Age causation were first presented by the French mathematician Joseph Adhemar in 1842, it was developed further by the English prodigy Joseph Croll in 1875, and the theory was established in its present form by the Czech mathematician Milutin Milankovich in the 1920s and 30s. In 1976 the prestigious journal "Science" published a landmark paper by John Imbrie, James Hays, and Nicholas Shackleton entitled "Variations in the Earth's orbit: Pacemaker of the Ice Ages," which described the correlation which the trio of scientist/authors had found between the climate data obtained from ocean sediment cores and the patterns of the astronomical Milankovich cycles. Since the late 1970s, the Milankovich theory has remained the predominant theory to account for Ice Age causation among climate scientists, and hence the Milankovich theory is always described in textbooks of climatology and in encyclopaedia articles about the Ice Ages.
In their 1976 paper Imbrie, Hays, and Shackleton wrote that their own climate forecasts, which were based on sea-sediment cores and the Milankovich cycles, ". must be qualified in two ways. First, they apply only to the natural component of future climatic trends - and not to anthropogenic effects such as those due to the burning of fossil fuels. Second, they describe only the long-term trends, because they are linked to orbital variations with periods of 20,000 years and longer. Climatic oscillations at higher frequencies are not predicted... the results indicate that the long-term trend over the next 20,000 years is towards extensive Northern Hemisphere glaciation and cooler climate."
During the 1970s the famous American astronomer Carl Sagan and other scientists began promoting the theory that `greenhouse gasses' such as carbon dioxide, or CO2, produced by human industries could lead to catastrophic global warming. Since the 1970s the theory of `anthropogenic global warming' (AGW) has gradually become accepted as fact by most of the academic establishment, and their acceptance of AGW has inspired a global movement to encourage governments to make pivotal changes to prevent the worsening of AGW.
The central piece of evidence that is cited in support of the AGW theory is the famous `hockey stick' graph which was presented by Al Gore in his 2006 film "An Inconvenient Truth." The `hockey stick' graph shows an acute upward spike in global temperatures which began during the 1970s and continued through the winter of 2006/07. However, this warming trend was interrupted when the winter of 2007/8 delivered the deepest snow cover to the Northern Hemisphere since 1966 and the coldest temperatures since 2001. It now appears that the current Northern Hemisphere winter of 2008/09 will probably equal or surpass the winter of 2007/08 for both snow depth and cold temperatures.
The main flaw in the AGW theory is that its proponents focus on evidence from only the past one thousand years at most, while ignoring the evidence from the past million years -- evidence which is essential for a true understanding of climatology. The data from paleoclimatology provides us with an alternative and more credible explanation for the recent global temperature spike, based on the natural cycle of Ice Age maximums and interglacials.
In 1999 the British journal "Nature" published the results of data derived from glacial ice cores collected at the Russia 's Vostok station in Antarctica during the 1990s. The Vostok ice core data includes a record of global atmospheric temperatures, atmospheric CO2 and other greenhouse gases, and airborne particulates starting from 420,000 years ago and continuing through history up to our present time.
The graph of the Vostok ice core data (See here) shows that the Ice Age maximums and the warm interglacials occur within a regular cyclic pattern, the graph-line of which is similar to the rhythm of a heartbeat on an electrocardiogram tracing. The Vostok data graph also shows that changes in global CO2 levels lag behind global temperature changes by about eight hundred years. What that indicates is that global temperatures precede or cause global CO2 changes, and not the reverse. In other words, increasing atmospheric CO2 is not causing global temperature to rise; instead the natural cyclic increase in global temperature is causing global CO2 to rise.
The reason that global CO2 levels rise and fall in response to the global temperature is because cold water is capable of retaining more CO2 than warm water. That is why carbonated beverages loose their carbonation, or CO2, when stored in a warm environment. We store our carbonated soft dri nks, wine, and beer in a cool place to prevent them from loosing their `fizz', which is a feature of their carbonation, or CO2 content. The earth is currently warming as a result of the natural Ice Age cycle, and as the oceans get warmer, they release increasing amounts of CO2 into the atmosphere.
Because the release of CO2 by the warming oceans lags behind the changes in the earth's temperature, we should expect to see global CO2 levels continue to rise for another eight hundred years after the end of the earth's current Interglacial warm period. We should already be eight hundred years into the coming Ice Age before global CO2 levels begin to drop in response to the increased chilling of the world's oceans.
The Vostok ice core data graph reveals that global CO2 levels regularly rose and fell in a direct response to the natural cycle of Ice Age minimums and maximums during the past four hundred and twenty thousand years. Within that natural cycle, about every 110,000 years global temperatures, followed by global CO2 levels, have peaked at approximately the same levels which they are at today.
About 325,000 years ago, at the peak of a warm interglacial, global temperature and CO2 levels were higher than they are today. Today we are again at the peak, and near to the end, of a warm interglacial, and the earth is now due to enter the next Ice Age. If we are lucky, we may have a few years to prepare for it. The Ice Age will return, as it always has, in its regular and natural cycle, with or without any influence from the effects of AGW.
The AGW theory is based on data that is drawn from a ridiculously narrow span of time and it demonstrates a wanton disregard for the `big picture' of long-term climate change. The data from paleoclimatology, including ice cores, sea sediments, geology, paleobotany and zoology, indicate that we are on the verge of entering another Ice Age, and the data also shows that severe and lasting climate change can occur within only a few years. While concern over the dubious threat of Anthropogenic Global Warming continues to distract the attention of people throughout the world, the very real threat of the approaching and inevitable Ice Age, which will render large parts of the Northern Hemisphere uninhabitable, is being foolishly ignored.
Source
Greenland ice melt 'may only be a temporary phenomenon'?
New study from mainstream scientists identifies changes at the glacial periphery -- such as changing ocean currents -- as the key factor in glacial change
The recent acceleration of glacier melt-off in Greenland, which some scientists fear could dramatically raise sea levels, may only be a temporary phenomenon, according to a study published Sunday. Researchers in Britain and the United States devised computer models to test three scenarios that could account for rapid -- by the standards applied to glaciers -- loss of mass from the Helheim Glacier, one of Greenland's largest.
Two were based on changes caused directly by global warming: an increase in the amount of water that greases the underbelly of the glacier as it slides toward the sea, and a general thinning due to melting. If confirmed, either of these explanations would point to a sustained increase in runoff over the coming decades, fueling speculation that sea level could rise faster and higher than once thought.
The stakes are enormous: the rate at which the global ocean water mark rises could have a devastating impact on hundreds of millions of people living in low-lying areas around the world. But a team led by Andreas Vieli and Faezeh Nick of Durham University in Britain found that neither of these scenarios matched the data. "They simply don't fit what we have observed," said Vieli in an interview. By contrast, the third computer model -- which hypothesised that melt-off was triggered by changing conditions in the confined area where the glacier meets the sea -- fit like a glove, he said. "Whatever happens at the terminus provokes a strong and rapid reaction in the rest of the glacier. The result has been a significant loss of mass" as huge chunks of ice drop into the ocean, a process known as calving, Vieli explained.
These changes are also set in motion by global warming, but are not likely to last, he said. "You cannot maintain these very high rates of peak mass loss for very long. The glaciers start to retreat and settle into a new an relatively stable state," he said.
The Helheim Glacier, along with several others in Greenland, started to slow down in 2007. Vieli also noted that the data alarming the scientific community only covers a span of a few years. It may be ill-advised, he suggested, to project a trend on the basis of what may turn out to be a short-term phenomenon.
The UN Intergovernmental Panel on Climate Change (IPCC) predicted in 2007 that sea levels could creep up by 18 to 59 centimetres (7.2 to 23.2 inches) by 2100 due to thermal expansion driven by global warming. Such an increase would be enough to wipe out several small island nations and seriously disrupt mega-deltas home in Asia and Africa. But IPCC failed to take into account recent studies on the observed and potential impact of the melting ice sheets in Greenland and Antarctica, prompting the Nobel-winning body to later remove the upward bracket from its end-of-century forecast.
A new consensus has formed among experts that levels could rise by a metre or more by 2100, according to Mark Serreze of the National No w and Ice Data Center in Boulder, Colorodo. "What has puzzled us is that the changes are even faster than we would have though possible," he said in a recent interview.
Vieli cautioned that his findings, published in Nature Geoscience, are narrowly focused on one glacier, and that sea levels could still rise higher than the IPCC's original projections. Other Greenland glaciers behave differently, and the dynamics of the Antarctic ice sheet are still poorly understood, he noted. Nor should the new study "be taken out of context to suggest that climate change is not a serious threat -- it is," he added. The ice sitting atop Greenland could lift oceans by seven metres, though even the gloomiest of climate change projections do not include such a scenario.
Source
Polar Sea Ice Changes are Having a Net Cooling Effect on the Climate
One of the most widely discussed climate feedbacks is the albedo effect of polar sea ice loss. Ice has a relatively high albedo (reflectance) so a reduction in polar ice area has the effect of causing more shortwave radiation (sunlight) to be absorbed by the oceans, warming the water. Likewise, an increase in polar sea ice area causes more sunlight to be reflected, decreasing the warming of the ocean. The earths radiative balance is shown in the image below. It is believed that about 30% of the sunlight reaching the earth's atmosphere is directly reflected - 20% by clouds, 6% by other components of the atmosphere, and 4% by the earth's surface.
We all have heard many times that summer sea ice minimums have declined in the northern hemisphere over the last 30 years. As mentioned above, this causes more sunlight to reach the dark ocean water, and results in a warming of the water. What is not so widely discussed is that southern hemisphere sea ice has been increasing, causing a net cooling effect. This article explains why the cooling effect of excess Antarctic ice is significantly greater than the warming effect of missing Arctic ice.
Over the last 30 years Antarctic sea ice has been steadily increasing, as shown below.
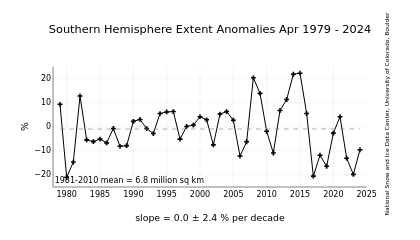
December is the month when the Antarctic sun is highest in the sky, and when the most sunlight reaches the surface. Thus an excess of ice in December has the maximum impact on the southern hemisphere's radiative balance. In the Antarctic, the most important months are mid-October through mid-February, because those are months when the sun is closest to the zenith. The rest of the year there is almost no shortwave radiation to reflect, so the excess ice has little effect on the shortwave radiative (SW) balance.
This has been discussed in detail by Roger Pielke Sr. and others in several papers. see here and here
So how does this work? Below are the details of this article's thesis.
More here
***************************************
For more postings from me, see DISSECTING LEFTISM, TONGUE-TIED, EDUCATION WATCH INTERNATIONAL, POLITICAL CORRECTNESS WATCH, FOOD & HEALTH SKEPTIC, GUN WATCH, SOCIALIZED MEDICINE, AUSTRALIAN POLITICS, IMMIGRATION WATCH INTERNATIONAL and EYE ON BRITAIN. My Home Pages are here or here or here. Email me (John Ray) here. For readers in China or for times when blogger.com is playing up, there is a mirror of this site here.
*****************************************


 Jim Hansen and his twin


1 comment:
Have you see a muslim demonstration against muslim terror?____
The Best mohammed T-shirt art is from Sweden. Watch and read the info at,
http://www.mohammedt-shirt.com
And allah will help the muslims HA HA HA
Post a Comment