
The Climate Wars is at the centre of a new TV global warming row after four contributors claimed it misrepresented them.The complaints surround the 14 September episode of the three-part, in-house programme, in which presenter Dr Iain Stewart interviewed key global warming sceptics, including Lord Monckton of Brenchley.
Lord Monckton has made a formal complaint to Ofcom and the BBC Trust that the programme-makers unfairly misrepresented him in a 90-minute interview. "In the two minutes it [BBC2] broadcast, it omitted all my scientific points, including my criticism of the defective 'hockey-stick' graph which the presenter had questioned me about," Monckton told Broadcast.
Canadian climate expert Dr Tim Ball and fellow contributor Dr Fred Singer also told Broadcast that they would complain to Ofcom and another scientist, Dr Roy Spencer, said he was considering complaining to both Ofcom and the BBC Trust.
The row follows the controversy that surrounded Channel 4's 2007 documentary The Great Global Warming Swindle.
Ofcom said it had received four complaints from viewers about the 14 September episode of Climate Wars. The BBC said it stood by the programme.
Source
Another skeptic: Dr. Martin Hertzberg, a retired Navy meteorologist with a PhD in physical chemistry
A letter to USA Today from Dr. Hertzberg [ruthhertzberg@msn.com]:
As a scientist and life-long liberal Democrat, I find the constant regurgitation of the anecdotal, fear mongering clap-trap about human-caused global warming (the Levi, Borgerson article of 9/24/08) to be a disservice to science, to your readers, and to the quality of the political dialogue leading up to the election. The overwhelming weight of scientific evidence shows that the Gore-IPCC theory that human activity is causing global warming is false. For details see my article, "The Lynching of Carbon Dioxide", in the "guest authors" section of www.carbon-sense.com .
The difference between a scientist and propagandist is clear. If a scientist has a theory, he searches diligently for data that might contradict it so that he can test it further or refine it. The propagandist carefully selects only the data that agrees with his theory and dutifully ignores any that contradicts it. The global warming alarmists don't even bother with data! All they have are half-baked computer models that are totally out of touch with reality and have already been proven to be false.
Here is some of the latest data. From the El Nino year of 1998 until Jan., 2007, the average temperature of the earth's atmosphere near its surface decreased some 0.25 C. From Jan., 2007 until the Spring of 2008, it dropped a whopping 0.75 C. The National Weather Service just issued a Sea Ice Advisory for the Western and Arctic Alaskan Coastal waters for significant ice developing in the next 10 to 14 days, with sea surface temperatures some 2 to 8 C colder than last year. Such recent data is "just the tip of the iceberg" that is in process of sinking the Gore-IPCC ship of cards.
Strong heat island effect now recognized by NASA
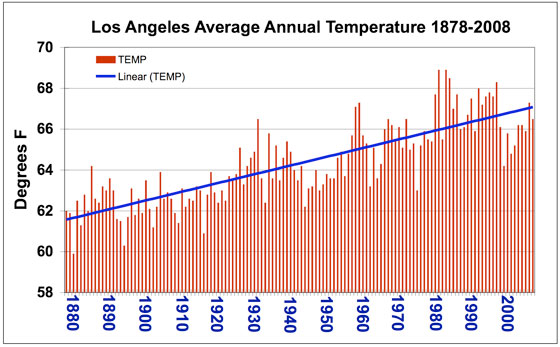
Summer 2008 in Southern California goes down in the books as cooler than normal. The thermometer in downtown Los Angeles topped 90 degrees Fahrenheit (32.2 degrees Celsius) just once in July, August and the first two-thirds of September. But don't expect this summer's respite from the usual blistering heat to continue in the years to come, cautions a group of NASA and university scientists: The long-term forecast calls for increased numbers of scorching days and longer, more frequent heat waves.
One hundred years of daily temperature data in Los Angeles were analyzed by scientists at NASA's Jet Propulsion Laboratory, Pasadena, Calif.; the University of California, Berkeley; and California State University, Los Angeles. They found that the number of extreme heat days (above 90 degrees Fahrenheit or 32.2 degrees Celsius in downtown Los Angeles) has increased sharply over the past century. A century ago, the region averaged about two such days a year; today the average is more than 25. In addition, the duration of heat waves (two or more extreme heat days in a row) has also soared, from two-day events a century ago to one- to two-week events today.
"We found an astonishing trend - a dramatic increase in the number of heat waves per year," says Arbi Tamrazian, lead author of the study, and a senior at the University of California, Berkeley.
Tamrazian and his colleagues analyzed data from Pierce College in Woodland Hills, Calif., and the Los Angeles Department of Water and Power in downtown Los Angeles. They tracked the number of extreme heat days and heat waves from 1906 to 2006. The team found that the average annual maximum daytime temperature in Los Angeles has risen by 5 degrees Fahrenheit (2.8 degrees Celsius) over the past century, and the minimum nighttime temperature has increased nearly as much. They also found that heat waves lasting six or more days have been occurring regularly since the 1970s. More recently, two-week heat waves have become more common....
So what's behind this long-term warming trend? Patzert says global warming due to increasing greenhouse gases is responsible for some of the overall heating observed in Los Angeles and the rest of California. Most of the increase in heat days and length of heat waves, however, is due to a phenomenon called the "urban heat island effect."
Heat island-induced heat waves are a growing concern for urban and suburban dwellers worldwide. According to the U.S. Environmental Protection Agency, studies around the world have shown that this effect makes urban areas from 2 to 10 degrees Fahrenheit (1 to 6 degrees Celsius) warmer than their surrounding rural areas. Patzert says this effect is steadily warming Southern California, though more modestly than some larger urban areas around the world. "Dramatic urbanization has resulted in an extreme makeover for Southern California, with more homes, lawns, shopping centers, traffic, freeways and agriculture, all absorbing and retaining solar radiation, making our megalopolis warmer," Patzert said.
These trends may capture the attention of utility companies and public health officials. "We'll be using more power and water to stay cool," says study co-author Steve LaDochy of California State University, Los Angeles. "Extreme heat, both day and night, will become more and more dangerous, even deadly."
Source
Shrinking Glaciers and Presidential Politics
CO2 Truth-Alert: Are earth's glaciers wasting away at an accelerating pace as a result of CO2-induced global warming? John McCain and Barack Obama believe they are, and they have plans for massive government programs to reverse the dreaded meltdown by reducing our country's CO2 emissions. But are these actions needed? Watch the video to find out.
Source
There is No Natural Evidence for Man-made Global Warming
This is the third in a seven part series detailing our objections to plans by the United States Environmental Protection Agency to claim unlimited power over the life of every American. Those plans were laid out in an Advance Notice of Proposed Rulemaking (ANPR), dated July 11, 2008. The EPA is inviting comments to this advance notice. This article explains the second of our six major objections to the EPA plans. The total of our objections, including our letter, our comments, and a link to the EPA website, may be accessed here
We oppose these measures on the grounds of natural history, because claims to man-made global warming contradict the evidence from Earth's past and present.
The provisions in the ANPR are based on a specious, unproven, scientifically unsupported, a-historical claim that impending disaster is caused by our very prosperity. This claim is leading us into the clear and present danger of federal economic controls imposed on a scale previously intolerable in the United States.
As a bedrock to its proposals the EPA has accepted the conclusions of the United Nations Intergovernmental Panel on Climate Change that man-made global warming is a settled issue. But the evidence of natural history shows no causal connection between so-called greenhouse gases and global temperatures. For a half a billion years, temperatures have risen and fallen independently of carbon dioxide (CO2) concentrations.
The EPA is also following the decision of the US Supreme Court that CO2, a natural compound vital to all living organisms, is a "pollutant." This ruling contradicts the evidence of natural history, the facts of biology, and the wisdom gleaned by farmers from 8,000 years of agriculture.
Claims that the Earth is now undergoing an unprecedented rise in temperature-both in absolute terms and in the rate of increase-should be examined using precedents from the long-term history of the Earth.[1] At least seven major ice age cycles have occurred in the last billion years, when mile-deep ice sheets periodically advanced beyond polar areas and engulfed regions that were once warm, before again melting in retreat. On a shorter timescale, some eleven glacial and interglacial periods have cycled during the past one million years. We are now living in a temporary interglacial warm period, the Holocene, that began with a relatively sudden rise in temperature about 11,000 years ago. We should expect the next glacial period to begin in the near future, meaning a few thousand years. These cyclical temperature changes in the Earth's prehistory have far surpassed the lesser variations since the dawn of industrial life.
What causes such temperature variations? One of the central tenets of the man-made global warming hypothesis is that high atmospheric concentrations of carbon dioxide (CO2) have a direct effect on temperatures around the globe. The thermometer, however, was not invented until the Renaissance. Scientists must study ancient temperatures and chemical concentrations indirectly, by gathering "proxy data" taken from fossils, tree rings, ice cores, coral reefs, peat bog cellulose and other evidence. All of this requires highly technical scientific interpretation, and is subject to new discoveries and complex methods of statistical analysis.
Using information derived from such proxy measurements, it is possible to reconstruct, at least roughly, temperature levels and the CO2 concentrations going back into the Earth's deep history. Dr. Christopher Scotese, a geologist at the University of Texas at Arlington, used ancient evidence and computer models to determine average temperatures going back over 600 million years ago (mya).[2] Other scientists have worked to determine CO2 concentrations.[3] A basic outline of these CO2 and temperature reconstructions is as follows (values are rounded to the accuracy implied in the figures). Bear in mind that the average temperature today is about 59øF, and CO2 is about 380 parts per million (ppm):
From 600 to 430 mya, CO2 was about 5000ppm; temperature was about 72øF. (One model has CO2 up to 7000 ppm, another as lower than 5000 ppm)
From 430 to 360 mya, CO2 fell below 1500ppm; temperatures shifted from 72øF to 54øF, then back up to 72øF
From 360 to 245 mya, CO2 fell to about 1000ppm; temperatures fell back to 54øF, then returned to 72øF, after a spike to 74øF
From 245 to 146 mya, CO2 held near 1000ppm; temperature stayed near 72øF, until falling to about 60øF. (Other reconstructions show CO2 as rising to about 2000 ppm about 200 mya, until falling again)
From 146 to 65 mya, CO2 decreased to 750ppm or less; temperatures-trending opposite to CO2-rose to 72øF
From 65 into the present, CO2 decreased to under 300ppm. Temperatures held at 72øF-far higher than today-then fell to 54øF before beginning to rise
This graph, Figure 1, illustrates these general trends. The heavy line shows average temperatures, the thin line shows a rough average of atmospheric CO2 concentrations:
Overall, the average global temperature has moved up and down between 54øF to 72øF, while atmospheric CO2 concentrations dropped from about 5000 to under 300ppm. If man-made global warming theory is correct, the Earth should have been blistering hot when CO2 was 16 times higher than today, and temperatures should have fallen when CO2 levels moved below 1000ppm. Even if other factors mitigated extreme temperature changes, there should be some correlation between temperatures and CO2. The Earth's temperatures, however, varied independently of the CO2. The Earth was an average of 72øF-far higher than today-when CO2 was both 5000ppm and under 750ppm.

Dr. R. Tim Patterson, professor of geology at Carleton University and director of the Ottawa-Carleton Geoscience Centre, wonders "whether Earth's climate record actually supports the assumption that CO2 is a major climate driver."[4] He reminds us that during an ice age about 450 million years ago, carbon dioxide concentrations were about 15 times higher than at present. He concludes that there is "no statistical correlation between the level of carbon dioxide in the atmosphere through the last 500 million years and the temperature record in this interval."
Scientists from the University of New Mexico wrote that their studies of goethite [iron oxide] formations in Wisconsin "suggest that 440 Myr ago [million years ago] atmospheric CO2 was ~ 16 times higher than today. However, this enhanced level of atmospheric CO2 does not seem to have been accompanied by unusually warm temperatures in the tropics, and in fact may have been contemporaneous with high-latitude continental glaciation on Gondwanaland [the southern super-continent]."[5]
Some scientists will dispute the precise figures here, and man-made global warming supporters will attack this overview as simplistic, but it remains clear that overall, global temperatures and CO2 variables have not at all correlated as the man-made global warming hypothesis requires and its proponents have maintained. This strongly suggests that other natural factors, not atmospheric CO2 concentrations, were controlling the temperature changes.
Variations During the Past Five-hundred Thousand Years
A picture of the more immediate past is seen in reconstructions of temperatures and CO2 concentrations derived from Antarctic ice core samples collected at the Russian Vostok Research Station. The ice core reached down over 3300 meters to reveal ice as old as 422,000 years. Scientists determine ancient temperatures by analyzing the ratio of heavier oxygen-18 to ordinary oxygen-16, and heavier deuterium-2 to ordinary hydrogen-1, in the ice.
Over the 422,000 years, temperatures have varied nearly 22øF, from about 16øF below to 6øF above the temperatures of the past century.[6] Scientists have noted that CO2 levels today "seem to have been unprecedented during the past 420,000 years."[7] But the highest temperatures recorded in the ice core samples are about 6øF higher than today, at 128,357 and 323,482 years ago. If CO2 levels today are "unprecedented" and CO2 causes warming, then why are temperatures today lower than at several times in the Antarctic past?
Scientists working under the auspices of the Scripps Institute of Oceanography brought greater precision to their reading of the Vostok data. In the abstract of their published research, they wrote: "High-resolution records from Antarctic ice cores show that carbon dioxide concentrations increased by 80 to 100 parts per million by volume 600 ñ 400 years after the warming of the last three deglaciations. Despite strongly decreasing temperatures, high carbon dioxide concentrations can be sustained for thousands of years during glaciations . . ." (emphasis added)[8]
Patterson recognized that the time lag between rising or falling temperature and rising or falling CO2 is about 800 years. To illustrate the causal implications of this relationship, he draws an analogy with human history. If you think that climate is being driven by CO2, "then you probably would have no difficulty in accepting the idea that Winston Churchill was instrumental in the defeat of King Herold by Duke William of Orange at the Battle of Hastings in 1066."
Dr. Willie Soon of the Harvard-Smithsonian Center for Astrophysics agrees that "Atmospheric CO2 variations generally follow changes in temperature and other climatic variables rather than preceding them." [9]
In his book An Inconvenient Truth, Al Gore ignores this time lag in order to create a false image of a frightening rise in temperature caused by CO2 emissions today.[10] He graphs CO2 and temperatures as rising and falling in parallel, thus depicting the "repeating correlation" that Patterson discussed: the two lines move in tandem, and the spike in CO2 to over 350ppm today runs ominously off the graph.
But Gore's visually impressive graph distorts the issue in two ways. First, it does not accommodate the earlier CO2 levels of up to 5000ppm, or 16 times those of today. The graph we have presented in this article, Figure 1 above, has a higher vertical CO2 axis, and depicts today's CO2 variations in accurate proportion to earlier changes: as tiny waves at the bottom right-hand side of the graph. Gore also omits values on the temperature axis, an egregious omission that makes it impossible to quantify the scale of temperature variations.
Second, Gore adds to the confusion by conflating correlation with causation. His parallel CO2 and temperature lines obscure the fact that large temperature rises preceded small CO2 rises by 500 to 1500 years. Perhaps it is inconvenient for Gore to accept that the huge 22øF temperature changes in the Vostok ice core samples cannot be explained by the tiny-100ppm-changes in CO2 that followed those temperature changes.
Gore's CO2 / temperature graph is a distortion of the historical record designed to elicit an emotional response for a political purpose.
More here
There's no such thing as a happy Greenie
AUSTRALIA'S most active unionist pushing for clean coal technology says the Greens are becoming increasingly marginalised by maintaining their opposition to clean coal. Greenies will never be happy because what they want is self-contradictory: A return to a primitive past plus all the comforts of modern life
CFMEU mining division president Tony Maher said his union had done polling that showed roughly 5 per cent of the population supported the Greens' position of opposition to clean coal. "A few years ago there was some scepticism about clean coal, but now you even have environmentalists ... like Tim Flannery who say 'we've got to fix coal'," Mr Maher said.
"I don't think their position has any environmental credibility or any economic credibility. On the environmental front, while coal is a big industry for Australia, we still only produce 4 per cent of the world's coal. We could shut down the industry tomorrow and other countries would just pick up the slack. And economically it would throw a huge amount of people out of work."
He said clean coal research in Australia was moving to a new level and that, while individual states had pursued worthwhile projects in the area, there was now a need for a nationally co-ordinated approach.
Mr Maher said as the states had control of the power system - and in the case of Queensland, were active participants in power generation - it was natural they would initially do most research into clean coal technology. He said that he was hopeful that Kevin Rudd's Global Institute for Carbon Capture and Storage, announced last week, would be able to fill such a role. "Energy is a state-based matter, and while all the research so far has been great, it all needs a bit of direction," Mr Maher said.
"The missing link so far has been co-ordination. In my view there's sufficient money now from both government and industry to get us to the stage of building pilot plants with zero emissions. But the real issue will be the large-scale plants which are commercially viable. Being able to get them coming on stream will mean you're going to have to guarantee commercial viability, and that will need a solid business case, and that's where you need to put together all this research that's being done."
He said Queensland had been the most active state in clean coal research, followed by Victoria. "NSW have got a bit of ground to make up," he said. "There is some research being done at Newcastle University, but it's nowhere near the amount being done in Queensland with Zerogen and with Victoria's Otway Basin project."
The Queensland Government has put $300 million towards the Zerogen project in central Queensland, which involves the construction of a zero-emissions pilot plant near Rockhampton. The Howard government refused to back the project, which is proceeding on a new basis with mining companies putting in extra money. The Queensland Resources Council, which represents coal mining companies, said that, while there was a need for more research, the issue was who paid for it.
QRC chief executive Michael Roche said: "The coal industry knows that in the long term, its social licence to operate does depend on successful commercialisation of low-emission coal technologies. "And as Professor Ross Garnaut has pointed out, this will require a huge investment of public funds, alongside industry funds, over the coming decade."
Source
***************************************
For more postings from me, see TONGUE-TIED, EDUCATION WATCH INTERNATIONAL, POLITICAL CORRECTNESS WATCH, FOOD & HEALTH SKEPTIC, GUN WATCH, SOCIALIZED MEDICINE, AUSTRALIAN POLITICS, DISSECTING LEFTISM, IMMIGRATION WATCH INTERNATIONAL and EYE ON BRITAIN. My Home Pages are here or here or here. Email me (John Ray) here. For readers in China or for times when blogger.com is playing up, there is a mirror of this site here.
*****************************************


 Jim Hansen and his twin


No comments:
Post a Comment