
Basic physics supports solar activity as cause of global warming
Comments from a successful long-range weather forecaster:
Science, not argument about conspiracy, must be central to the debate about climate change (Letters, November 13), nevertheless Al Gore's stake in green business (Generation Investment Management) and David Miliband's closeness to the nuclear industry merit attention. Dr Wolff's claim that the climate-sceptical position "is in contradiction to everything we expect from basic physics" is bizarre, since physics is the basis of Weather Action's world-leading solar weather technique of long-range forecasting. The SWT relies on predictable effects of solar particles, not on CO2 or meteorology models - and I can assure your correspondent Richard Nunn that the SWT will be published when matters of intellectual property are sorted out
Dr Wolff admits "CO2 has indeed increased in response to temperature change in the past ..." This is a general pattern in slow changes over the last 250,000 years (Caillon et al, Science, March 2003). Furthermore proxy measurements covering thousands of years (eg Neff et al, Nature 2001) show that, in timescales of 22 years, the magnetic sun-spot cycle and world temperatures move together, whereas CO2, while following temperature in slow general terms, also moves the other way for quite long periods. This contradicts the theory that CO2 drives temperature and climate.
Current CO2 levels, or rate of CO2 rise, are not unprecedented. CO2 levels have been three times current levels (Bob Carter, Marine Geophysical Lab, Queensland). CO2 rapid rise "spikes" doubtless happened before, given the power of nature compared with man's puny activity (not even 1% of total greenhouse effect), but ice-core data smoothes them out.
The global warmers' claim that current extra CO2 causes warming which gets dangerously magnified through the greenhouse effect of extra water vapour in the atmosphere, consequent to the temperature rise, also fails. The sea absorbs extra CO2. Furthermore, increased transpiration-cooling by enhanced growth of plants, which is caused by extra CO2, cancels out the extra greenhouse warming of that same CO2. Increased greenhouse heating due to doubling CO2 is 3.7 watts per sq metre. This is negated by about the same amount of enhanced transpiration-cooling of plants, all of which grow faster in extra CO2. Therefore there is no CO2 driven net heat flow and surface temperature rise. Temperature and climate change in our epoch is therefore driven by other factors, especially solar particle and magnetic effects.
So can action against climate change make a difference? Even if temperature trends can be changed - and controlling the sun is a tall order even for a Bush/ Blair legacy - there is no evidence of connected change in weather extremes or useful outcomes. Let's save the planet from real chemical pollutants, but CO2 is not one of them. Wouldn't it be better to work to predict climate than make vain attempts to change it?
Source
THE STALAGMITE STORY
Do stalagmites grow from the ceiling or the floor of cave? Time is up -- they grow from the floor of caves (stalactites grow from the ceiling), but the key is that they grow over long periods of time. Some stalagmites are thousands of years old and if they are in just the right type of cave, they can preserve a signal of temperature and precipitation levels over the time they grew.
A team of scientist from Austria and Germany located three stalagmites in the Spannagel Cave located around 2,500 m above sea level at the end of the Tux Valley in Tyrol (Austria) close to the Hintertux glacier. The temperature of the cave stays near freezing and the relative humidity in the cave is always at or near 100%. The stalagmites grew at a rate between 17 and 75 millionths of a meter per year and are nearly 10,000 years old.
The trick to extracting a temperature signal from the stalagmites involves measuring the oxygen 18 isotope (d18O) levels of each small layer from a sample taken from the features in the Spannagel Cave. Given the near perfect conditions in the cave, the d18O levels are determined by the temperature of the drip water at the time the layer was formed. Vollweiler et al. report that the resulting record "may thus be interpreted as a temperature signal with low d18O values corresponding to warmer temperatures and high d18O values corresponding to colder temperatures."
The results are seen in Figure 1 (below) and the Little Ice Age (LIA) and Medieval Warm Period (MWP) stand out prominently along with other major climate features of the Holocene. The authors note that the record "exhibits substantial oscillations with low d18O values between 7.5 and 5.9 kyr (Holocene Climatic Optimum), 3.8 and 3.6, and 1.2 and 0.7 kyr (MWP) and high d18O between 7.9 and 7.5, 5.9 and 5, 3.5 and 3 kyr, and 600 and 150 yr (LIA)." In discussing warm periods of the past, they note "Between 2.25 and 1.7 kyr, a time known as the Roman Warm Period (RWP), some of the Alpine passes were ice-free also in winter." Further, they note that the record "has a pronounced peak at 2.2 kyr, synchronous with Hannibal's crossing of the Alps in 218 BC." The stalagmite is screaming to us that many periods in the past 9,000 years were warmer than present-day conditions!
The team of scientists notes that variations in vegetation, glacier extension, timberline, tree-ring width, and lake and river histories indicate major climate oscillations during the past few thousand years. Figure 2 shows a comparison of the d18O record with European glacial extension and lake level data. All three records clearly show (a) the Little Ice Age, (b) the Medieval Warm Period, and (c) periods in the past that are warmer than today.
So are the stalagmites telling us a story that only applies for conditions around the cave or for conditions that affected much of the planet? Two articles have appeared recently in major journals with results that reinforce the stalagmite story, but from very distant parts of the world. Achim Brauning of the University of Stuttgart headed off to southern Tibet to core trees to study climate variations preserved in the ring widths and composition. Brauning notes that other tree ring series from Tibet "have shown that the period from 1150 to 1380 was characterized by higher temperatures than today" and that "The succeeding period from 1430 until the late nineteenth century witnessed a series of cold intervals indicated by growth reductions and changes in the isotopic composition in juniper trees." Brauning concludes that "Larch trees from a third glacier forefield in southeastern Tibet show evidence of glacier activity from 1580 to 1590, from the end of the eighteenth to the beginning of the nineteenth century and from 1860 to 1880." The Little Ice Age seems to come through loud and clear in the trees of southern Tibet.
Finally, a pair of scientists from the United States and Canada cored a lake in southeastern British Columbia and examined variations in pollen spores through layers of the core. Hallett and Hills found that between 700 and 150 years ago, the Kootenay Valley had returned to a wet closed forest "that appears to be a response to Little Ice Age cooling."
Al Gore and the Intergovernmental Panel on Climate Change rolled out the Hockey Stick that showed little variation in climate until the great warm-up of the last 100 years. But as we see in a cave in Austria, trees in Tibet, and pollen in a lake in British Columbia, there is overwhelming evidence of considerable climate variability over the past 1,000 to 10,000 years.
Source
ATOMIC WARMING A LOT WORSE
Climate Change: The secretary-general of the United Nations gets around to making a serious statement on the state of the planet, but the statement turns out to be just plain silly. But he's not the only one making it. Addressing the U.N.'s annual climate change conference in Nairobi, Kenya, on Wednesday, Kofi Annan said global warming is as much of a threat as weapons of mass destruction.
We suppose we could dismiss the silly statement as that of a world figure playing to an audience on his way out of office. But we've heard the same statement too often from other supposedly rational leaders to brush it off. Hans Blix, for example. In 2003, the former U.N. chief weapons inspector told MTV: "I'm more worried about global warming than I am of any major military conflict." Sure, it was a frivolous comment intended for a frivolous audience, but . . . Bill Clinton, supposedly one of our brightest presidents, insisted in May at the University of Texas that "climate change is more remote than terror, but a more profound threat to the future of the children and the grandchildren and the great-grandchildren I hope all of you have." Then there's Al Gore. "I don't want to diminish the threat of terrorism at all; it is extremely serious," the former vice president told Australia's newspaper the Age last year. "But on a long-term global basis, global warming is the most serious problem we are facing."
Maybe these men just haven't thought about what's going on around them. On Tuesday, the day before Annan declared climate change as much of a threat as "conflict, poverty, the proliferation of deadly weapons," President Mahmoud Ahmadinejad of Iran said his country will go nuclear in just a few months. Some weapons experts say Ahmadinejad's regime could have an atomic weapon in a mere five years. Some say it's more like two.
Meanwhile, global warming, even if it proves to be real, will not begin to have an impact for generations. The U.N.'s own Intergovernmental Panel on Climate Change has projected that the earth's temperature will rise 1.4 degrees to 5.8 degrees Celsius by the end of the century. That works out to 0.14 degree to 0.58 degree a decade -- small changes over a lengthy span. The sort of climate change that concerns us is the warming from cities incinerated by nuclear weapons launched by Ahmadinejad or the equally crazed Kim Jong Il of North Korea, or by a terrorist group sponsored and supplied by those two.
Global warming remains nothing more than a theory. If it turns out to be real, there is still time to act -- if we want to act. We say "if" because there's evidence a warmer earth might be of great benefit to mankind: longer growing seasons (increased food production); warmer winters, with warmth occurring primarily at night (cutting heating bills and energy use); less disease; more rain (decreasing famine); and fewer cold-related deaths. "From a purely evolutionary point of view, warm periods have been exceptionally good to us," Benny Peiser, a social anthropologist at Liverpool John Moores University, told Wired magazine last year. "Cold periods have been the troublesome ages."
Far more troublesome would be a nuclear age in which rogue regimes and terrorists have access to atomic weapons.
Source
SUBURBS ACQUITTED
If absence makes the heart grow fonder in far-flung romances, it seems a bit of elbow-room does the same for neighbours. A new study says that people who live in sprawling suburban areas have more friends, better community involvement and more frequent contact with their neighbours than urbanites who are wedged in side-by-side. The results challenge the accepted idea that suburban life is socially alienating a notion that's inspired everything from the Academy Award-winning American Beauty to Harvard professor Robert Putnam's book Bowling Alone.
The study, released by the University of California at Irvine, found that for every 10 per cent decrease in population density, the chances of people talking to their neighbours weekly increases by 10 per cent, and the likelihood they belong to hobby-based clubs jumps by 15 per cent. "We found that interaction goes down as population density goes up. So, turning it around, it says that interaction is higher where densities are lower," says Jan Brueckner, an economics professor at UC Irvine who led the study. "What that means is suburban living promotes more interaction than living in the central city."
The results are no surprise to Fayrouz Costa, who has lived in and loved the Toronto suburb of Mississauga, Ont., for the last 20 years. She has two young children and is constantly socializing with her neighbours, who take turns watching over each other's children while they play outside and house-sitting for those on vacation. "You couldn't give me a free house in the city and say, `Move here.' Honestly, I could never do it," she says. "There's just too many people, people are too close to each other and people are not friendly. I'm a chatterer and people don't chat in the city."
Costa is a member of her community centre, where she uses the fitness facilities five days a week and knows "almost everyone." She contrasts her lifestyle with that of her sister, who lives and works in Toronto, and concludes that she "would never leave the suburbs." "People are always in a rush to get where they need to go and they work a lot more," Costa says of life in the city. "A lot of the time in the suburbs, people have families and their life is a little more relaxed."
That "social homogeneity" may partly explain the closeness of neighbours in the suburbs, says Pierre Filion, a professor of urban planning at the University of Waterloo. Young children often act as social catalysts for their parents, and people in the suburbs tend to have more common ground than the diverse lifestyles crammed into a given city block, he says. "People (in the suburbs) are pretty much of the same social class, same social background and so on, which eases interaction between people," Filion says. "At the other extreme, you can have a whole bunch of people living in a condo, but you've got old people, young people, people in between. You won't have that much interaction because of the differences."
Brueckner says the UC Irvine study accounted for differences in social class, family structure and other factors, and found that people are still friendlier in the suburbs. The results suggest society needs to re-think some received wisdom about the evils of suburbia, he says, but other criticisms about the loss of green space and the costs of commuting still stand.
Source
Hollywood hypocrites outed
They insist that they are trying to save the planet, but Hollywood's green celebrities are seething over new criticism of their muddled environmental activism. The latest targets of internet watchdogs are the stars who drive electric or hybrid cars and then hop on private jets to fly around the world.
The environment has become one of Hollywood's most fashionable causes, with stars abandoning limousines at premieres for low fuel consumption cars. Yet several of the film industry's biggest names have fallen foul of internet sleuths who have compared their eco-friendly driving habits with their fondness for private aircraft. Julia Roberts was last week reported by the TMZ film buffs' website to be the owner of a Toyota Prius, the first commercially produced car with a hybrid electric-petrol engine. TMZ also noted Roberts travelled by private jet from Chicago to Los Angeles, consuming 2,100 gallons of fuel.
Other Prius drivers with a fondness for private jets include Jennifer Lopez and Brad Pitt, whose recent private charter to Namibia with his lover, Angelina Jolie, burnt an estimated 11,000 gallons of jet fuel - "enough to take a Prius to the moon", said TMZ.
George Clooney, one of Hollywood's most outspoken liberal activists, owns an electric minicar called a Tango, which drives 135 miles on a full battery. But he recently took a private jet to Tokyo, a 5,500-mile trip which consumed 7,000 gallons of fuel. Clooney's spokesman said the actor often had "no control" over his schedule, which is dictated by studio commitments.
Leonardo DiCaprio was one of the first celebrities to drive a Prius. He was also the latest star to fall foul of green scrutiny when the New York Post reported that he flew his mother, grandmother and girlfriend from Paris to Rome in a private jet for the Italian premiere of his latest film, The Departed.
Defenders of celebrity greens argue that the attention they bring to eco-issues is worth the ideological confusion, but others are less convinced. "If they flew on regular airlines they might be forgiven," said a contributor to TMZ. "But flying private jets makes them look like idiots."
Source
***************************************
Many people would like to be kind to others so Leftists exploit that with their nonsense about equality. Most people want a clean, green environment so Greenies exploit that by inventing all sorts of far-fetched threats to the environment. But for both, the real motive is to promote themselves as wiser and better than everyone else, truth regardless.
Global warming has taken the place of Communism as an absurdity that "liberals" will defend to the death regardless of the evidence showing its folly. Evidence never has mattered to real Leftists
Comments? Email me here. My Home Pages are here or here or here. For times when blogger.com is playing up, there are mirrors of this site here and here.
*****************************************
Friday, November 24, 2006
GLOBAL WARMING DURING THE DAY ONLY??
It couldn't be that pesky old sun that causes the warming and cooling all by itself, could it? Some interesting data from Australia
It is amazing to me, that there is very limited analysis into temperatures at certain times of the day. Even the IPCC Climate Change 2001 report only looks at maximum and minimum temperatures. We concluded here that minimum temperatures have increased significantly from about the 1980's, but have stayed around the same level since then. The increase in Australia has been 0.3 degrees since 1980. We also concluded also that there has recently, especially in the last 5 years been an increase in Australia's maximum temperature, however the increase is statistically insignificant. The graph on this link clearly shows an increase in maximum temperatures since around 1960, but not quite to the level that they were in the 19th century.
So what is happening in these last few years of increase in maximum temperatures? It is strange that research has not decided to look into this, and has generally just accepted the fact that we are warming up.
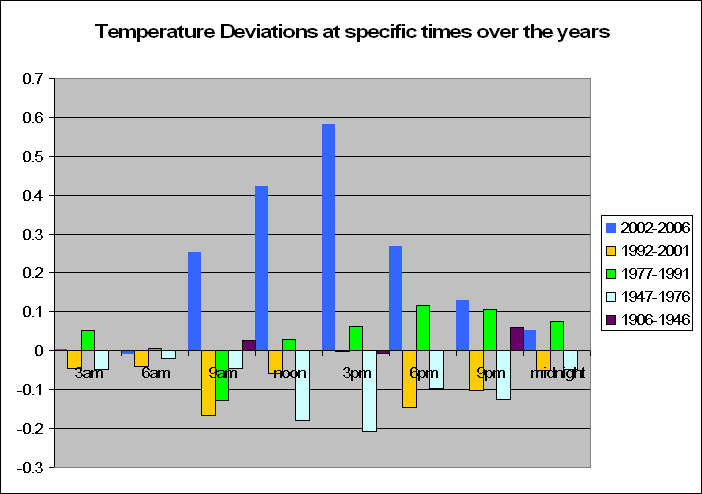
The graph shows the deviations from the norm at certain times of the day with reference to last 5 years, 15, 30, 60 and 100 years. Data for the last 100 years was only available for 9am, 3pm and 9pm.
Lets look at the last 5 years to start off with. At the heat of the day, at around 3pm, we see that temperatures in the last 5 years have increased by on average almost 0.6 degrees. But interestingly, at other times of the day, the decrease is less. In fact at 3am and 6am, when the sun does not shine, there is no increase at all in temperature. As the earth spins further away from the sun, the temperature deviation from the norm decreases. Between 1992 and 2001 we had less than normal temperatures with the exception of 3pm. The previous 15 years before that showed an increase in temperatures at around the 6pm to 9pm mark, and from 1947 to 1976, where it is well known that maximum temperatures were on the decrease, this graph shows this. With temperatures at what would normally be at the peak, 3pm, being around 0.2 degrees below the norm. Interestingly here, that when the sun is on the other side of the world, the temperature difference is minimal.
So why is it that in most recent times, we are heating up during the heat of the day and not at other times? Admittedly it is only a small sample size of 5 years, but it might well be worth some debate. This data clearly proves, that Australia is not uniformly heating up at all times, but only when the sun is at its peak. Hence the reason why we get increased maximum temperatures more recently.
It is interesting, that the increased maximum temperatures of late only occur because of an increasing temperature around 3pm (the heat of the day) and not at other times. Likewise the decreased maximum temperature from around 1947 to 1976 only occurred because of a decrease in temperatures around 3pm (the heat of the day) and largely not at other times.
If CO2 were the primary causer of increased temperatures in Australia, then wouldn't we get a more consistent temperature increase throughout the day and night? Analysis at certain times of the year, and when there is/isn't cloud cover might well be the key here. Keep in mind however, that the increase in temperature over the past 5 years is not significant, but is still worth a look into, as it seems this is rarely done in the literature.
Source
Follow-up comment:
Recently we showed that when Australian maximum temperatures increased, the actual temperature only increased when the sun was out. Likwise, from 1947 to 1970 when temperatures decreased, the decrease only occured when the sun was out. Hence, when maximum temperatures are up or down, we are not seeing an increase/decrease throughout the day of temperatures but only at the heat of the day (around 3pm) when the sun is at it's hottest.
Maybe the sun has something to do with the discrepancies in maximum temperatures perhaps? Well Scafetta and West's (2006) research seems that it could agree with us saying that:
The sun might have contributed approximately 50% of the observed global warming since 1900
50% Wow! That's like....half. Maybe there is something in this. Which would you bet causes more warming....CO2 levels or the sun? Hmmm....
Source
IGNORED URBAN HEAT SINKS
The point made below is reinforced by the fact that all the warming seems to be in the much more heavily populated Northern Hemisphere
I am writing to you regarding the recent onslaught of publicity surrounding the 'global treaty', greenhouse gasses and the subject of global warming in general. Personally, I'm quite tired of pseudo-scientist enviro-zealots going completely overboard on a subject which has no scientific relevance at all - their assumptions regarding the theory of global warming do not remotely resemble science, whatsoever.
I've read a great deal on the subject of global warming in the past few years. In fact, I started out with a very open mind on the subject, but quickly realized that this 'theory' was nothing more than an absurd myth. It is absolutely incredible that an argument still exists on the subject - obviously it provides a great deal of job security for thousands of individuals. I'm certain that it would be much cheaper to place these well meaning dolts on unemployment rather than continue this ludicrous investigation.
While I acknowledge that ground level temperatures on earth have risen about 1 degrees Fahrenheit over the past hundred and forty years, I also realize that cities have sprung up and grown dramatically in that same period. What materials are these cities comprised? Let's see....trillions and trillions of tons of brick, mortar, stone, block, tar, concrete, asphalt, etc.
I do have a degree in mechanical engineering and I passed my heat transfer requirement with flying colors.....but I really don't need those credentials to understand that these cities are massive 'heat sinks' which have grown at an amazing rate over this period of time. I can watch the weather report every night and see that the temperatures in Baltimore and Washington, DC are often 4 - 7 degrees warmer than they are at my farm in Walkersville, MD. I often see differences as much as 10 degrees (or more) at night, when these massive heat sinks are dissipating the heat that they collected all day.
It's truly amazing that most global warming fanatics are too obtuse to realize this phenomenon, especially when they preach that the most noticeable increases in temperature are at night. There is one other crucial tidbit of information that supports the idea that warming is a ground level phenomenon caused by urban sprawl - we've used satellite data for approximately twenty years to study atmospheric temperatures....and they have shown a slight decrease in global temperatures....remarkable, isn't it?
I've enclosed two charts which were provided in a recent Washington Post article - it is readily apparent that temperature fluctuations on this planet are a very normal occurrence....without our influence. Scientists (and pseudo scientists) are looking at data from the last 140 years - this is merely a blip in time and many individuals are jumping to ridiculous conclusions, including a couple of well known individuals located on Pennsylvania Avenue.
There is little doubt that in three hundred years we will look back at this atrocious episode in the same manner that we currently view the Salem witch trials of the 1600's. The fallacy of global warming is driven by a mob mentality, which lacks any semblance of scientific evidence - in fact, the scientific evidence that exists completely undermines this stupid theory. The arguments of the global warming faction are mind boggling - as each of their predictions fails to materialize, they are only momentarily swayed and revise their predictions accordingly. They are also great manipulators of the news of natural events after they occur. The zealots point at normal events and declare that most of these occurrences are obviously the result of global warming - warm weather, cold weather, hurricanes, hail, flooding, high tide, low tide, turbulent weather, calm weather, the sun rising in the east, the sun setting in the west, inflation, death and taxes - you name it, global warming is the culprit. Ironically, while these zealots are dying to tell everyone 'I told you so', they are continually stymied by bad predictions and repeatedly rely upon the occurrence of normal events to prove their counterfeit theory.
Meanwhile, the press has promulgated the myth since apocalypse makes compelling news, while evidence disproving global warming results in a very slow news day. The nay-sayers are automatically shunned and branded as conspirators siding with the evil oil empire. I can honestly say that the only kick-back I receive from the oil industry is 6 cents a gallon at the gas pump on Thrifty Thursdays.
In conclusion, I'd like to make one very important point. I'm very pro-environment -- but I'm also anti-stupidity. Global warming is a very stupid non-scientific myth. It's time for someone to stand up and say, "the King has no clothes." No, wait a minute, who are we kidding here? It's time for someone to stand up and say, "the King has no clothe -- and he's quite ugly too." Let's stop funding $2.1 billion annually on a fairy tale, and for God's sake, do not legislate the eradication, reduction, moderation, elimination, termination, dissolution, or regulation of anything based on something THAT DOES NOT EXIST!
Source
SPOKESMAN FOR U.S SENATOR SAYS CLIMATE SCEPTICS ARE 'DEMONISED'
A spokesman for the U.S. senator who described global warming as a hoax showed up at a gathering of believers Tuesday, claiming scientific dissent on the issue was being suppressed and demonized. One scholar shot back that the Senate aide must be living on another planet. The exchange took place at the U.N. conference on climate change, which has drawn more than 5,000 diplomats, activists and scientists to consider new steps in combating global warming.
"The skeptics who get vocal are vilified," said Marc Morano, director of communications for the Senate Environment and Public Works Committee. The committee chairman, Republican Sen. James Inhofe of Oklahoma, has enraged environmentalists by calling global warming alarmist and a hoax.
Morano was invited to be part of a panel discussion on how best to convey the issue of climate change in the media. His fellow panelists, including Jules Boykoff of Pacific University in Oregon, argued that skeptics actually get too much attention in the press. Efforts by journalists to create "balanced" stories on global warming allow "a handful of skeptics ... to be treated as equals to thousands of scientists," said Boykoff, an assistant professor in the department of politics and government. Liisa Antilla, a geographer and scholar of global warming, said it was wrong for journalists to "frame climate science as uncertain."
The Intergovernmental Panel on Climate Change, the U.N. network of more than 2,000 climate and other scientists, says rising temperatures will expand oceans via heat and runoff of melting land ice; shift climate zones, disrupting agriculture; and lead to more frequent and intense climate events, such as the drought now in its fourth year in East Africa. Major climate scientists point out that skeptics on global warming rarely publish in peer-reviewed journals, the cornerstone of modern science. As evidence of climate change has mounted in recent years, the skeptics' voices have lessened. "The shrillness of these skeptics and their numbers have been on the decline," Rajendra K. Pachauri, chairman of the IPCC, told The Associated Press before the panel discussion.
But Morano referred to the two-week U.N. conference as an "echo chamber" where "the media and climate alarmists demonize climate skeptics." Pal Prestrud, director of the Center for International Climate and Environmental Research, shot back that "we're on different planets or maybe even different galaxies."
Source
MONCKTON DEBUNKS MONBIOT
The original moonbat is a scientific ignoramus
It's a shame that George Monbiot didn't check his facts with me before using his column to describe my two recent Sunday Telegraph articles on climate change as "nonsense from start to finish" (This is a dazzling debunking of climate change science. It is also wildly wrong, November 14). He implies that a classically trained peer ought not to express scientific opinions. It's still a free country, George. And at least I got the science right.
George says my physics is "bafflingly bad" and contains "downright misrepresentation and pseudo-scientific gibberish". Yet he himself nonsensically refers to "lambda" as a "constant" in the Stefan-Boltzmann radiative-transfer equation. Lambda is not a constant, and it's not a term in the equation.
He wrongly states that the equation only describes "black bodies" that absorb all radiant energy reaching them. No qualified physicist would make such a schoolboy howler. Of course the equation isn't limited to black bodies. Its emissivity variable runs from zero for white bodies to 1 for black bodies. The Earth/troposphere system is a rather badly-behaved grey body with emissivity about 0.6.
He lifted these errors verbatim from a blog run by two authors of a now-discredited UN graph that tried to abolish the medieval warm period. I'd exposed the graph in my articles. Check your sources, George.
He says I was wrong to reinstate the medieval warm period cited by the UN in 1990 but abolished by it in 2001. A growing body of scientific papers, some of which I cited, shows that the warm period was real, global and up to 3C warmer than now. Check them out, George.
He says I shouldn't have said the Viking presence in the middle ages shows Greenland was warmer than now. The Viking farmsteads in Greenland are now under permafrost, and you can't farm permafrost.
He says I was wrong to say James Hansen told Congress in 1988 that world temperature would rise 0.3C by 2000. Hansen projected 0.25 and 0.45C, averaging 0.35C. Outturn was 0.05C. I fairly said 0.3C and 0.1C. He says my source was a work of fiction by Michael Crichton. It wasn't: it was Hansen's graph.
He says I overlooked the difference between the immediate and delayed temperature response to changing conditions. In fact I expressly addressed it, citing evidence on both sides of the theory that the delayed air-temperature response arises from warming of the oceans.
He says I said the warming effects of carbon dioxide had been "made up". I didn't. I said all were agreed that there was more CO2 around and that we could expect some warming. But there is no consensus on how much.
He says I claimed to know better than the UN's scientists. I'm arrogant, George, but not that arrogant: I said the contrarians were probably a lot closer to the truth than the UN.
Too many facts wrong. Too much argument ad hominem instead of ad rem. Too much ignorance of the elementary physics of radiative transfer and equilibrium temperature. Still, gie the puir numpty a cigar - at least he spelled my name right.
Source
Gore gored
Below are some excerpts from Viscount Monckton's detailed reply to Al Gore. Gore's words are in italics. The full doc is here (PDF). Prof. Brignell also has some derisory comments on Gore's defence.
To begin with, there is a reason why new scientific research is peer-reviewed and then published in journals such as Science, Nature, and the Geophysical Research Letters, rather than the broadsheets.˜ The process is designed to ensure that trained scientists review the framing of the questions that are asked, the research and methodologies used to pursue the answers offered, and even, in some cases, to monitor the funding of the laboratories - all in order to ensure that errors and biases are detected and corrected before reaching the public.
There were some 90 references to learned papers in the scientific journals in the document supporting my article on the science of climate change that was posted on the Telegraph's website. This commentary, too, is supported by a substantial list of some 60 references to learned papers in journals including the three mentioned by Gore. The many journal references (hundreds more could have been cited) demonstrate that there is no scientific consensus that the effect of increased greenhouse-gas concentrations on the climate will be as serious as the UN's reports suggest. But I shall also take some references from the UN's assessment reports, with apologies that they are more political and less scientific than the papers in the journals. The Summaries for Policymakers at the head of each of the UN's reports are written not by scientists at all but by the political representatives of governments. There is repeated evidence of substantial and significant departures from the science in these political Summaries. In every instance, the discrepancies move in the direction of overstating and exaggerating the supposed problem even more than the scientific sections.
That level of scrutiny is typically not applied to newspaper columns of course, but since the stakes are so high in the debate over the climate crisis I would like to review here just a few of the misleading claims in Viscount Monckton's submissions to illustrate my belief that readers of The Telegraph should rely upon more reliable and authoritative sources than the Viscount for information on the latest climate science.
That level of scrutiny is typically not applied to books or films, of course, but since the stakes are so high in the debate over the climate "crisis" I should like to review here just a few of the misleading claims in Gore's film An Inconvenient Truth, to illustrate my belief that cinema-goers should rely upon more reliable and authoritative sources than Gore for information on the latest climate science. Here is Senator James Inhofe's list of some of Gore's scientific errors:
* Gore promoted the now-debunked "hockey stick" temperature chart for the past 1,000 years in an attempt to prove man's overwhelming impact on the climate, and attempted to debunk the significance of the mediaeval warm period and little ice age (for discussion and references, see below).
* Gore insisted on a link between increased hurricane activity and global warming that most sciences believe does not exist (for discussion and references, see below).
* Gore asserted that today's Arctic is experiencing unprecedented warmth while ignoring that temperatures in the 1930's were as warm or warmer (NCDC, 2006);
* Gore said the Antarctic was warming and losing ice but failed to note, that is only true of a small region and the vast bulk has been cooling and gaining ice (see my first article).
* Gore hyped unfounded fears that Greenland's ice is in danger of disappearing (for discussion and references, see below).
* Gore erroneously claimed that ice cap on Mt. Kilimanjaro is disappearing due to global warming, though satellite measurements show no temperature change at the summit, and the peer-reviewed scientific literature suggests that desiccation of the atmosphere in the region caused by post-colonial deforestation is the cause of the glacial recession (see my first article).
* Gore made assertions of massive future sea level rise that is way out side of any supposed scientific "consensus" and is not supported in even the most alarmist literature (for discussion and references, see below).
* Gore incorrectly implied that a Peruvian glacier's retreat is due to global warming, while ignoring the fact that the region has been cooling since the 1930s and other glaciers in South America are advancing (see Polissar et al., 2005, for an interesting discussion of glaciers in the tropical Andes).
* Gore blamed global warming for water loss in Africa's Lake Chad, though NASA scientists had concluded that local water-use and grazing patterns are probably to blame (Foley and Coe, 2001).
* Gore inaccurately said polar bears are drowning in significant numbers due to melting ice when in fact 11 of the 13 main groups in Canada are thriving, and there is evidence that the only groups that are not thriving are in a region of the Arctic that has cooled (Taylor, 2006).
* Gore did not tell viewers that the 48 scientists whom he quoted as having accused President Bush of distorting science were part of a political advocacy group set up to support the Democrat Presidential candidate, John Kerry, in 2004.
Gore is now an adviser to the UK Government on climate change.
First, Monckton claims that Dr. James Hansen of NASA said that the temperature would rise by 0.3C and that the sea level would rise by several feet.˜ But Hansen did not say that at all, and the claim that he did is extremely misleading. In fact, Dr. Hansen presented three scenarios to the U.S. Senate (high, medium, and low).˜ He explained that the middle scenario was "most plausible" and, as it turned out, the middle scenario was almost exactly right.˜
Hansen's three scenarios, presented to Congress during the very hot summer of 1988, projected global mean temperature increases of 0.3C, 0.25C and 0.45C respectively in the 12 years to 2000: an average of 0.33C. But 0.06C was the actual increase (NCDC, 2006). I fairly said 0.3C and 0.1C.
As to sea levels, I corrected this point in my second article. Mean sea level is difficult to measure. It probably rose by less than 1 inch between 1988 and 2000; the rate of increase - 1 inch every 15 years - has not risen for a century; and there is little reason to suppose that the rate of increase should accelerate. Morner (2004), who has spent a lifetime in the study of sea levels, provides an "official evaluation of the sea-level changes that are to be expected in the near future." He finds that "sea level records are now dominated by the irregular redistribution of water masses over the globe ... primarily driven by variations in ocean current intensity and in the atmospheric circulation system and maybe even in some deformation of the gravitational potential surface."
Morner says: "The mean eustatic rise in sea level for the period 1850-1930 was in the order of 1.0-1.1 mm/year," but that "after 1930-40, this rise seems to have stopped (Pirazzoli et al., 1989; Morner, 1973, 2000)."˜This stasis, in his words, "lasted, at least, up to the mid-60s."˜Thereafter, "the record can be divided into three parts: (1) 1993-1996 with a clear trend of stability, (2) 1997-1998 with a high-amplitude rise and fall recording the ENSO event of these years and (3) 1998-2000 with an irregular record of no clear tendency."˜Most important of all, in his words, "There is a total absence of any recent `acceleration in sea level rise' as often claimed by IPCC and related groups."
He concludes: "When we consider past records, recorded variability, causational processes involved and the last century's data, our best estimate of possible future sea-level changes is +10 +/- 10cm in a century, or, maybe, even +5 +/- 15cm." See also Morner (1995); INQUA (2000).
Van der Veen (2002) intended "to evaluate the applicability of accumulation and ablation models on which predicted ice-sheet contributions to global sea level are based, and to assess the level of uncertainty in these predictions arising from uncertain model parameters."˜He concluded that "the validity of the parameterizations used by glaciological modeling studies to estimate changes in surface accumulation and ablation under changing climate conditions has not been convincingly demonstrated."
Munk (2003) says: "Surveys of glaciers, ice sheets, and other continental water storage can place only very broad limits of -1 to +1 mm/year on sea level rise from freshwater export." It is not known how the cryosphere will respond to global warming.˜
Braithwaite and Raper (2002) analyze mountain glaciers and ice caps, excluding the Greenland and Antarctic ice sheets.˜ They begin by saying: "The temperature sensitivity of sea level rise depends upon the global distribution of glacier areas, the temperature sensitivity of glacier mass balance in each region, the expected change of climate in each region, and changes in glacier geometry resulting from climate change."˜ They end by reporting that "None of these are particularly well known at present," and they conclude that "glacier areas, altitudes, shape characteristics and mass balance sensitivity are still not known for many glacierized regions and ways must be found to fill gaps."
Monckton goes on to level a serious accusation at all the scientists involved in the Intergovernmental Panel on Climate Change, claiming that they have "repealed a fundamental physical law" and as a result have misled the people of the world by exaggerating the sensitivity of the Earth's climate to extra carbon dioxide.˜If this were true, the entire global scientific community would owe Monckton a deep debt of gratitude for cleverly discovering a gross and elementary mistake that had somehow escaped the attention of all the leading experts in the field.
Here and elsewhere, I shall not respond to ad hominem remarks, but shall comment only ad rem. As will be shown below, the shortfall between the observed 20th-century temperature increase of 0.45 to 0.6C and the 20th-century increase of 1.6 to 3.75C that would have been expected from the projections made by the models upon which the UN relies is unwarranted either in the laws of physics or in the 20th-century global mean surface air temperature record. This shortfall between reality and the UN's projections is well established in the scientific literature (see, for instance, Hansen, 2006), though until my article was published it was not known to the public. There is certainly no scientific consensus on the reason for the very substantial discrepancy. Some, such as the Hadley Centre (IPCC 2001, quoted by Lindzen, 2006) blame pollutant aerosols for reflecting some of the Sun's radiance back to space. Others (such as Barnett, 2005, or Levitus, 2005), say the oceans are acting as a heat-sink. If there is in fact no good reason for the discrepancy between reality and projection, and if - as I am by no means alone in thinking - the UN's models are simply over-projecting the likely temperature effects of elevated greenhouse gas concentrations, then the UN's projections of future temperature increases may be around three times greater than they should be.
But again, this charge is also completely wrong, and it appears in this case to spring from the Viscount's failure to understand that these complex, carefully constructed supercomputer climate models not only have built into them the physical law he thinks he has discovered is missing, but also many others that he doesn't mention, including the fundamentally important responses of water vapor, ice and clouds that act to increase the effects of extra carbon dioxide.
The laws of physics say the increase in temperature is 0.3C for every additional watt per square metre of temperature. The UN says 0.5C (IPCC 2001). Several physicists have confirmed my result, which readers may like to check for themselves using a scientific calculator.....
Both in my article and in the supporting discussion document and calculations, I explicitly mentioned climate feedbacks from water vapour and ice-melt. I did not mention climate feedbacks from clouds because, as the UN itself says, even the direction of the change in radiative forcing and hence in temperature caused by clouds is not known (IPCC 2001). I explained that the UN's reason for using a figure nearly twice what the laws of physics mandate for the increase in temperature for each watt of additional forcing was to incorporate an allowance for climate feedbacks.
However, I demonstrated that, if one assumed that the UN's positive climate feedbacks were matched by negative feedbacks, the observed climate response over the 98 years 1900-1998 was identical to the climate sensitivity projected by use of the UN's greenhouse-gas forcing equation. In short, there is no direct observational evidence in the 20th-century global mean surface air temperature record that any allowance at all should be made for climate feedbacks in response to temperature increases arising from elevated greenhouse-gas concentrations in the atmosphere. As will be seen, the implications for forward projections of temperature increase are substantial.
Moreover, direct observations from the 20th century, from the last ice age and from the atmosphere's response to volcanic eruptions, all give estimates of the earth's sensitivity to extra CO2 that are exactly in line with model results (around a 3 degrees Celsius warming for a doubling of the CO2 concentration).
The UN gives observed centennial temperature change as 0.6C, equivalent to 1.98wm-2. So projected figure of 5.36wm-2 derived from the UN's model results using the UN's own formula and coefficients projects a sensitivity to extra CO2 that is not exactly or even approximately in line with observation, but is in fact 2.7 times greater than what was actually observed.
Direct observations from the last ice age
Direct observations from the last ice age were not possible. We were not here. Temperatures and CO2 concentrations have been indirectly deduced from samples of air from former ages locked in the ice of Greenland or Antarctica. The results do not provide a basis for reliable estimates of the earth's sensitivity to extra CO2: they show that increases in CO2 do not precede increases in temperature - they follow it.
Petit et al. (1999) reconstructed surface air temperature and atmospheric CO2 concentration profiles from Vostok ice core samples covering 420,000 years, concluding that during glaciation "the CO2 decrease lags the temperature decrease by several thousand years" and "the same sequence of climate forcing operated during each termination."
Using sections of ice core records from the last three inter-glacial transitions, Fischer et al. (1999) decided that "the time lag of the rise in CO2 concentrations with respect to temperature change is on the order of 400 to 1000 years during all three glacial-interglacial transitions."
On the basis of atmospheric carbon dioxide data obtained from Antarctic Taylor Dome ice core samples, and temperature data obtained from the Vostok ice core, Indermuhle et al. (2000) looked at the relationship between these two variables over the period 60,000-20,000 years ago. A statistical test on the data showed that movement in the air's CO2 content lagged behind shifts in air temperature by approximately 900 years, while a second statistical test yielded a mean lag-time of 1200 years.
Similarly, in a study of air temperature and CO2 data obtained from high time resolution samples at the Antarctic Concordia Dome site, for the period 22,000-9,000 ago, covering the last glacial-to-interglacial transition, Monnin et al. (2001) found that the start of the CO2 increase lagged the start of the temperature increase by 800 years.
In yet another study of the 420,000-year Vostok ice-cores, Mudelsee (2001) concluded that variations in atmospheric CO2 concentration lagged behind variations in air temperature by 1,300 to 5,000 years.
In a study using different methodology, Yokoyama et al. (2000) analyzed sediments in the tectonically stable Bonaparte Gulf of Australia to determine the timing of the initial melting phase of the last great ice age.
Commenting on the results of that study, Clark and Mix (2000) note that the rapid rise in sea level caused by the melting of land-based ice that began approximately 19,000 years ago preceded the post-glacial rise in atmospheric CO2 concentration by about 3,000 years.
Caillon et al. (2003) focused on an isotope of argon (40Ar) that can be taken as a climate proxy, thus providing constraints about the relative timing of CO2 shifts and climate change. Air bubbles in the Vostok ice core over the period that comprises Glacial Termination III - which occurred 240,000 years ago - were studied. They found that "the CO2 increase lagged behind Antarctic deglacial warming by 800 ~ 200 years."
We conclude that there is plentiful evidence in the scientific literature that increases in atmospheric CO2 have followed increases in temperature in former ages and cannot have been the cause of those increases. In this respect, ice-core studies can tell us no more than that there may be a small climate feedback from increased atmospheric CO2 in response to temperature.
Direct observations of the atmosphere's response to volcanic eruptions
The most recent major volcanic eruption to have been observed directly was that of Mount Pinatubo, in the Philippines, in June 1991. Sassen (1992) reported that cirrus clouds were produced during the eruption, Lindzen et al. (2001) proposed that cirrus clouds might provide a possible negative feedback that might partially counteract the positive feedbacks assumed in the UN's climate feedback factor.
Douglass and Knox (2005) considered this negative climate feedback in some detail: "We determined the volcano climate sensitivity and response time for the Mount Pinatubo eruption, using observational measurements of the temperature anomalies of the lower troposphere, measurements of the long wave outgoing radiation, and the aerosol optical density." They reported "a short atmospheric response time, of the order of several months, leaving no volcano effect in the pipeline, and a negative feedback to its forcing."
They also note that the short intrinsic climate response time they derived (6.8 ~ 1.5 months) "confirms suggestions of Lindzen and Giannitsis (1998, 2002) that a low sensitivity and small lifetime are more appropriate" than the "long response times and positive feedback" assumed in the UN's models. They conclude that "Hansen et al.'s hope that the dramatic Pinatubo climate event would provide an `acid test' of climate models has been fulfilled, although with an unexpected result."
Conclusion
We conclude, on the basis of a study of the UN's own reports and of the academic literature in the peer-reviewed scientific journals, that the UN may have failed to take negative climate feedbacks sufficiently into account, there is no consensus among climate scientists on any of the three classes of evidence for the UN's estimate of climate sensitivity cited by Gore, and that in all three classes - 20th-century observation, palaeoclimatological reconstruction and studies of volcanic eruption - there is recent, frequent and compelling evidence in the scientific literature that raises serious questions about the validity of the "consensus" position.
And, despite Viscount Monckton's recycled claims about the so-called "hockey stick" graph (an old and worn-out hobby horse of the pollution lobby in the U.S.), this faux controversy has long since been thoroughly debunked. The global warming deniers in the U.S. were so enthusiastic about this particular canard that our National Academy of Sciences eventually put together a formal panel, comprised of a broad range of scientists including some of the most skeptical, which vindicated the main findings embodied in the "hockey stick" and definitely rejected the claims Monckton is now recycling for British readers.
No. In fact the committee of the National Research Council, (North et al., 2006), which answers to the National Academies of Sciences and of Engineering, while confident that today's temperatures are warmer than at any time in the past 400 years, was "less confident" about the UN "hockey-stick" graph's abolition of the mediaeval warm period, because of a lack of data before 1600 AD. The committee's report criticized the methodology of the authors of the "hockey-stick", The committee notes explicitly, on pages 91 and 111, that the method used in compiling the UN's "hockey-stick" temperature graph has no validation skill significantly different from zero. Methods without a validation skill are usually considered useless.
Similar grounds for concern were listed in a report by three independent statisticians for the US House of Representatives (Wegman et al., 2005), who found that the calculations behind the "hockey-stick" graph were "obscure and incomplete". Criticisms of the hockey-stick summarized in my article came from papers in the learned journals: e.g. McIntyre and McKitrick (2005). Wegman et al. (2005) found these criticisms "valid and compelling". It found that the scientists who had compiled the graph had not used statistical techniques properly, and found no evidence that they had "had significant interactions with mainstream statisticians". It found that the scientists' "sharing of research material, data and results was haphazardly and grudgingly done." It found that the peer review process, by which other scientists are supposed to verify learned papers before publication, "was not necessarily independent". Finally, it found that the "hockey-stick" scientists' "assessments that the decade of the 1990s was the hottest decade of the millennium and that 1998 was the hottest year of the millennium cannot be supported by their analysis". It recommended that State-funded scientific research should be more carefully and independently peer-reviewed in future, not only by the learned journals but also by the UN's climate change panel. It recommended that authors of the UN's scientific assessments should not be the same as the authors of the learned papers on which the UN relies; that State-funded scientists should make their data and calculations openly and promptly available; and that statistical results by scientists who were not statisticians should be peer-reviewed by statisticians.
The NAS stated that the late 20th century warming in the Northern Hemisphere was unprecedented during at least the last 1,000 years and probably for much longer than that. They also noted that the finding has "subsequently been supported by an array of evidence."
No. In fact, North et al. (2006) said this: "Less confidence can be placed in proxy-based reconstructions of surface temperatures for A.D. 900 to 1600, although the available proxy evidence does indicate that many locations were warmer during the past 25 years than during any other 25-year period since 900. ˜Very little confidence can be placed in statements about average global surface temperatures prior to A.D. 900 because the proxy data for that time frame are sparse." These quotations, taken from an executive summary signed by all members of the committee that prepared the report, bear no relation to what Gore says they said.
As to the "array of evidence" supporting the "hockey-stick" graph's conclusion that there was no mediaeval warm period - a conclusion which could not be properly drawn from the methodology used to produce the graph itself - Wegman et al. (2005) said: "In our further exploration of the social network of authorships in temperature reconstruction, we found that at least 43 authors have direct ties to [the graph's lead author] by virtue of coauthored papers with him. Our findings from this analysis suggest that authors in the area of paleoclimate studies are closely connected and thus `independent studies' may not be as independent as they might appear on the surface."
So, no matter how many charts or graphs the Viscount might want to create, the basic facts remain the same. What the models have shown, unequivocally, is that carbon dioxide and other greenhouse gases mainly released from industrial activities are warming the planet.
My first article said: "There are more greenhouse gases in the air than there were, so the world should warm a bit, but that's as far as the `consensus' goes." There is no consensus at all on how much warming there will be, or about whether or when it will be dangerous. Models are of theoretical interest, but they are not definitive. Until recently they contained "flux adjustments" - or fudge-factors - many times larger than the very small changes in tropospheric radiant energy that are at issue.
Computer models are not capable of showing anything "unequivocally": they are suitable only for making projections, which may or may not prove reliable. The models upon which the UN so heavily relied failed to predict either the timing or the magnitude of the El Nino Southern Oscillation event in 1998. More recently they have failed to predict the sharp cooling of the climate-relevant surface layer of the ocean that has occurred in the past two years (Lyman, 2006).
Sixty Canadian scientists expert in climate and related fields, writing to the Canadian Prime Minister earlier this year (Canada, 2006) said: "Observational evidence does not support today's computer climate models, so there is little reason to trust model predictions of the future."
Dr. Vincent Gray, a research scientist and a reviewer working on the UN's 2001 report (IPCC, 2001) has noted, "The effects of aerosols, and their uncertainties, are such as to nullify completely the reliability of any of the climate models."
Freeman Dyson, an eminent physicist, said this in a talk to the American Physical Society (Dyson, 1999): "The bad news is that the climate models on which so much effort is expended is unreliable. The models are unreliable because they still use fudge-factors rather than physics to represent processes occurring on scales smaller than the grid-size. . The models fail to predict the marine stratus clouds that often cover large areas of ocean. The climate models do not take into account the anomalous absorption of radiation revealed by the Atmospheric Radiation Measurements. This is not a small error. If the ARM are correct, the error in the atmospheric absorption of sunlight calculated by the climate models is about 28 watts per square metre, averaged over the whole Earth, day and night, summer and winter. The entire effect of doubling the present abundance of carbon dioxide is calculated to be about four watts per square metre. So the error in the models is much larger than the global warming effect that the models are supposed to predict. Until the ARM were done, the error was not detected, because it was compensated by fudge-factors that forced the models to agree with the existing climate. Other equally large errors may still be hiding in the models, concealed by other fudge-factors. Until the fudge-factors are eliminated and the computer programs are solidly based on local observations and on the laws of physics, we have no good reason to believe the predictions of the models. . They are not yet adequate tools for predicting climate. . We must continue to warn the politicians and the public, `Don't believe the numbers just because they come out of a supercomputer.'"
Eugene Parker, a leading solar physicist, has said: "The inescapable conclusion is that we will have to know a lot more about the Sun and the terrestrial atmosphere before we can understand the nature of the contemporary changes in climate. . In our present state of ignorance it is not possible to assess the importance of individual factors. The biggest mistake that we could make would be to think that we know the answers when we do not" (Parker, 1999).
Scientists have also carefully examined the real world evidence (temperature change as measured by air balloons, ground and satellite measurements, proxies like ice cores and tree rings, for example) and have found that the models do indeed match the observations.
Until last year, the observations did not even match each other. NASA (2005) said the trend in satellite measurements of the lower troposphere (from the surface to about 5 miles up) was just 0.08C per decade since 1979, but the trend in surface temperature measured on the ground (NCDC, 2006) is twice that, 0.16C per decade in the same period. NASA (2005) commented: "These differences are the basis for discussions over whether our knowledge of how the atmosphere works might be in error, since the warming aloft in the troposphere should be at least as strong as that observed at the surface." More recently, however, NASA has found that its satellite sensors had been pointing in the wrong direction. Satellite tropospheric temperature trends now accord with those at the surface. Balloon temperatures were also out of alignment with both surface and satellite temperatures for many years. Recently, however, a correction has been made to the handling of the data and they now conform.
Furthermore, the fact of warming does not tell us its cause. Though carbon dioxide and other greenhouse gases are likely to be a contributing factor, they are not likely to be the only factor, and may not even be the main one. Even if greenhouse gases are the sole factor, there is no consensus about the UN's projected warming trend for the future. Besides, as we have shown, the models do not match the observed change in temperature, the discrepancy is large, and there is no consensus either about the reason for the discrepancy or about whether the discrepancy is real.
It is important to understand that there is not just one single strand of evidence leading us to believe that global warming is occurring, but rather that all of the peer-reviewed evidence, from scientists around the world, points in the same direction.
Mr. Gore says that all of the peer-reviewed evidence points in the same direction. A very large proportion of it points in the opposite direction, as the papers listed here make plain. For instance, Soon and Baliunas (2003) listed some 240 scientific papers in which a period of at least 50 years of anomalous drought, rainfall or temperature were indicated at some time during the mediaeval warm period. The authors of the "hockey-stick" graph angrily dismissed Soon and Baliunas (2003) as irrelevant, but - whatever the paper's faults - it demonstrates that the "consensus" repeatedly claimed by the UN and its supporters is far from real.
To be sure, not all of the finest workings of the climate system are yet fully understood to the finest grain. However, all of the basics are absolutely clear.˜ Global warming is real, human activities are causing the problem, many of the solutions are available to us now, it is not too late to avoid the worst, and all we need to get started solving the crisis is the political will to act.
"Global Warming Is Real", says Gore. Sixty leading climatologists and scientists in related fields wrote to the Canadian Prime Minister (Canada, 2006): "Climate Change Is Real" is a meaningless phrase used repeatedly by activists to convince the public that a climate change catastrophe is looming and humanity is the cause. Neither of these fears is justified. Global climate changes occur all the time due to natural causes, and the human impact still remains impossible to distinguish from the natural `noise'."
For the third time Gore recites the already-agreed fact of warming. However, there is no consensus on whether or to what degree human activities are causing "the problem", or even whether there is a problem. Global cooling, widely predicted in the 1970s, would have been much more dangerous than warming. The unusual hot weather in mainland Europe killed 3,000 elderly Frenchmen a couple of years ago. Like so many other events, it was blamed on global warming but was not caused by manmade climate change. It arose from natural climate variability. The most recent cold snap in the UK killed 25,000 people.
This is what prompted the national academies of science in the 11 most influential nations on the planet to come together to jointly call on every nation to "acknowledge that the threat of climate change is clear and increasing." They added that the "scientific understanding of climate changes is now sufficiently clear to justify nations taking prompt action."
The "scientific understanding" is so crude that the central question - by how much can the temperature be expected to rise as a result of a given additional amount of greenhouse gas in the atmosphere - has not been definitively established either empirically or theoretically. It has been established by laboratory experiment that increased CO2 concentrations can cause additional scattering of outgoing longwave radiation at the tropopause, but not at or near the surface, and only at the fringes of one of the three principal absorption bands of CO2. It has been established that the stratosphere is cooling, suggesting that less outgoing radiation is emerging from the tropopause. But it is insufficiently clear whether or to what extent the temperature increase since 1900 is attributable to anthropogenic as opposed to natural factors, and it is not even clear by how much the temperature rose between 1900 and 1998 (NCDC US global mean temperature anomaly 0.3C, AccuWeather from land-based stations 0.45C, NCDC global mean 0.53C; UN 0.6C).
***************************************
Many people would like to be kind to others so Leftists exploit that with their nonsense about equality. Most people want a clean, green environment so Greenies exploit that by inventing all sorts of far-fetched threats to the environment. But for both, the real motive is to promote themselves as wiser and better than everyone else, truth regardless.
Global warming has taken the place of Communism as an absurdity that "liberals" will defend to the death regardless of the evidence showing its folly. Evidence never has mattered to real Leftists
Comments? Email me here. My Home Pages are here or here or here. For times when blogger.com is playing up, there are mirrors of this site here and here.
*****************************************
It couldn't be that pesky old sun that causes the warming and cooling all by itself, could it? Some interesting data from Australia
It is amazing to me, that there is very limited analysis into temperatures at certain times of the day. Even the IPCC Climate Change 2001 report only looks at maximum and minimum temperatures. We concluded here that minimum temperatures have increased significantly from about the 1980's, but have stayed around the same level since then. The increase in Australia has been 0.3 degrees since 1980. We also concluded also that there has recently, especially in the last 5 years been an increase in Australia's maximum temperature, however the increase is statistically insignificant. The graph on this link clearly shows an increase in maximum temperatures since around 1960, but not quite to the level that they were in the 19th century.
So what is happening in these last few years of increase in maximum temperatures? It is strange that research has not decided to look into this, and has generally just accepted the fact that we are warming up.
The graph shows the deviations from the norm at certain times of the day with reference to last 5 years, 15, 30, 60 and 100 years. Data for the last 100 years was only available for 9am, 3pm and 9pm.
Lets look at the last 5 years to start off with. At the heat of the day, at around 3pm, we see that temperatures in the last 5 years have increased by on average almost 0.6 degrees. But interestingly, at other times of the day, the decrease is less. In fact at 3am and 6am, when the sun does not shine, there is no increase at all in temperature. As the earth spins further away from the sun, the temperature deviation from the norm decreases. Between 1992 and 2001 we had less than normal temperatures with the exception of 3pm. The previous 15 years before that showed an increase in temperatures at around the 6pm to 9pm mark, and from 1947 to 1976, where it is well known that maximum temperatures were on the decrease, this graph shows this. With temperatures at what would normally be at the peak, 3pm, being around 0.2 degrees below the norm. Interestingly here, that when the sun is on the other side of the world, the temperature difference is minimal.
So why is it that in most recent times, we are heating up during the heat of the day and not at other times? Admittedly it is only a small sample size of 5 years, but it might well be worth some debate. This data clearly proves, that Australia is not uniformly heating up at all times, but only when the sun is at its peak. Hence the reason why we get increased maximum temperatures more recently.
It is interesting, that the increased maximum temperatures of late only occur because of an increasing temperature around 3pm (the heat of the day) and not at other times. Likewise the decreased maximum temperature from around 1947 to 1976 only occurred because of a decrease in temperatures around 3pm (the heat of the day) and largely not at other times.
If CO2 were the primary causer of increased temperatures in Australia, then wouldn't we get a more consistent temperature increase throughout the day and night? Analysis at certain times of the year, and when there is/isn't cloud cover might well be the key here. Keep in mind however, that the increase in temperature over the past 5 years is not significant, but is still worth a look into, as it seems this is rarely done in the literature.
Source
Follow-up comment:
Recently we showed that when Australian maximum temperatures increased, the actual temperature only increased when the sun was out. Likwise, from 1947 to 1970 when temperatures decreased, the decrease only occured when the sun was out. Hence, when maximum temperatures are up or down, we are not seeing an increase/decrease throughout the day of temperatures but only at the heat of the day (around 3pm) when the sun is at it's hottest.
Maybe the sun has something to do with the discrepancies in maximum temperatures perhaps? Well Scafetta and West's (2006) research seems that it could agree with us saying that:
The sun might have contributed approximately 50% of the observed global warming since 1900
50% Wow! That's like....half. Maybe there is something in this. Which would you bet causes more warming....CO2 levels or the sun? Hmmm....
Source
IGNORED URBAN HEAT SINKS
The point made below is reinforced by the fact that all the warming seems to be in the much more heavily populated Northern Hemisphere
I am writing to you regarding the recent onslaught of publicity surrounding the 'global treaty', greenhouse gasses and the subject of global warming in general. Personally, I'm quite tired of pseudo-scientist enviro-zealots going completely overboard on a subject which has no scientific relevance at all - their assumptions regarding the theory of global warming do not remotely resemble science, whatsoever.
I've read a great deal on the subject of global warming in the past few years. In fact, I started out with a very open mind on the subject, but quickly realized that this 'theory' was nothing more than an absurd myth. It is absolutely incredible that an argument still exists on the subject - obviously it provides a great deal of job security for thousands of individuals. I'm certain that it would be much cheaper to place these well meaning dolts on unemployment rather than continue this ludicrous investigation.
While I acknowledge that ground level temperatures on earth have risen about 1 degrees Fahrenheit over the past hundred and forty years, I also realize that cities have sprung up and grown dramatically in that same period. What materials are these cities comprised? Let's see....trillions and trillions of tons of brick, mortar, stone, block, tar, concrete, asphalt, etc.
I do have a degree in mechanical engineering and I passed my heat transfer requirement with flying colors.....but I really don't need those credentials to understand that these cities are massive 'heat sinks' which have grown at an amazing rate over this period of time. I can watch the weather report every night and see that the temperatures in Baltimore and Washington, DC are often 4 - 7 degrees warmer than they are at my farm in Walkersville, MD. I often see differences as much as 10 degrees (or more) at night, when these massive heat sinks are dissipating the heat that they collected all day.
It's truly amazing that most global warming fanatics are too obtuse to realize this phenomenon, especially when they preach that the most noticeable increases in temperature are at night. There is one other crucial tidbit of information that supports the idea that warming is a ground level phenomenon caused by urban sprawl - we've used satellite data for approximately twenty years to study atmospheric temperatures....and they have shown a slight decrease in global temperatures....remarkable, isn't it?
I've enclosed two charts which were provided in a recent Washington Post article - it is readily apparent that temperature fluctuations on this planet are a very normal occurrence....without our influence. Scientists (and pseudo scientists) are looking at data from the last 140 years - this is merely a blip in time and many individuals are jumping to ridiculous conclusions, including a couple of well known individuals located on Pennsylvania Avenue.
There is little doubt that in three hundred years we will look back at this atrocious episode in the same manner that we currently view the Salem witch trials of the 1600's. The fallacy of global warming is driven by a mob mentality, which lacks any semblance of scientific evidence - in fact, the scientific evidence that exists completely undermines this stupid theory. The arguments of the global warming faction are mind boggling - as each of their predictions fails to materialize, they are only momentarily swayed and revise their predictions accordingly. They are also great manipulators of the news of natural events after they occur. The zealots point at normal events and declare that most of these occurrences are obviously the result of global warming - warm weather, cold weather, hurricanes, hail, flooding, high tide, low tide, turbulent weather, calm weather, the sun rising in the east, the sun setting in the west, inflation, death and taxes - you name it, global warming is the culprit. Ironically, while these zealots are dying to tell everyone 'I told you so', they are continually stymied by bad predictions and repeatedly rely upon the occurrence of normal events to prove their counterfeit theory.
Meanwhile, the press has promulgated the myth since apocalypse makes compelling news, while evidence disproving global warming results in a very slow news day. The nay-sayers are automatically shunned and branded as conspirators siding with the evil oil empire. I can honestly say that the only kick-back I receive from the oil industry is 6 cents a gallon at the gas pump on Thrifty Thursdays.
In conclusion, I'd like to make one very important point. I'm very pro-environment -- but I'm also anti-stupidity. Global warming is a very stupid non-scientific myth. It's time for someone to stand up and say, "the King has no clothes." No, wait a minute, who are we kidding here? It's time for someone to stand up and say, "the King has no clothe -- and he's quite ugly too." Let's stop funding $2.1 billion annually on a fairy tale, and for God's sake, do not legislate the eradication, reduction, moderation, elimination, termination, dissolution, or regulation of anything based on something THAT DOES NOT EXIST!
Source
SPOKESMAN FOR U.S SENATOR SAYS CLIMATE SCEPTICS ARE 'DEMONISED'
A spokesman for the U.S. senator who described global warming as a hoax showed up at a gathering of believers Tuesday, claiming scientific dissent on the issue was being suppressed and demonized. One scholar shot back that the Senate aide must be living on another planet. The exchange took place at the U.N. conference on climate change, which has drawn more than 5,000 diplomats, activists and scientists to consider new steps in combating global warming.
"The skeptics who get vocal are vilified," said Marc Morano, director of communications for the Senate Environment and Public Works Committee. The committee chairman, Republican Sen. James Inhofe of Oklahoma, has enraged environmentalists by calling global warming alarmist and a hoax.
Morano was invited to be part of a panel discussion on how best to convey the issue of climate change in the media. His fellow panelists, including Jules Boykoff of Pacific University in Oregon, argued that skeptics actually get too much attention in the press. Efforts by journalists to create "balanced" stories on global warming allow "a handful of skeptics ... to be treated as equals to thousands of scientists," said Boykoff, an assistant professor in the department of politics and government. Liisa Antilla, a geographer and scholar of global warming, said it was wrong for journalists to "frame climate science as uncertain."
The Intergovernmental Panel on Climate Change, the U.N. network of more than 2,000 climate and other scientists, says rising temperatures will expand oceans via heat and runoff of melting land ice; shift climate zones, disrupting agriculture; and lead to more frequent and intense climate events, such as the drought now in its fourth year in East Africa. Major climate scientists point out that skeptics on global warming rarely publish in peer-reviewed journals, the cornerstone of modern science. As evidence of climate change has mounted in recent years, the skeptics' voices have lessened. "The shrillness of these skeptics and their numbers have been on the decline," Rajendra K. Pachauri, chairman of the IPCC, told The Associated Press before the panel discussion.
But Morano referred to the two-week U.N. conference as an "echo chamber" where "the media and climate alarmists demonize climate skeptics." Pal Prestrud, director of the Center for International Climate and Environmental Research, shot back that "we're on different planets or maybe even different galaxies."
Source
MONCKTON DEBUNKS MONBIOT
The original moonbat is a scientific ignoramus
It's a shame that George Monbiot didn't check his facts with me before using his column to describe my two recent Sunday Telegraph articles on climate change as "nonsense from start to finish" (This is a dazzling debunking of climate change science. It is also wildly wrong, November 14). He implies that a classically trained peer ought not to express scientific opinions. It's still a free country, George. And at least I got the science right.
George says my physics is "bafflingly bad" and contains "downright misrepresentation and pseudo-scientific gibberish". Yet he himself nonsensically refers to "lambda" as a "constant" in the Stefan-Boltzmann radiative-transfer equation. Lambda is not a constant, and it's not a term in the equation.
He wrongly states that the equation only describes "black bodies" that absorb all radiant energy reaching them. No qualified physicist would make such a schoolboy howler. Of course the equation isn't limited to black bodies. Its emissivity variable runs from zero for white bodies to 1 for black bodies. The Earth/troposphere system is a rather badly-behaved grey body with emissivity about 0.6.
He lifted these errors verbatim from a blog run by two authors of a now-discredited UN graph that tried to abolish the medieval warm period. I'd exposed the graph in my articles. Check your sources, George.
He says I was wrong to reinstate the medieval warm period cited by the UN in 1990 but abolished by it in 2001. A growing body of scientific papers, some of which I cited, shows that the warm period was real, global and up to 3C warmer than now. Check them out, George.
He says I shouldn't have said the Viking presence in the middle ages shows Greenland was warmer than now. The Viking farmsteads in Greenland are now under permafrost, and you can't farm permafrost.
He says I was wrong to say James Hansen told Congress in 1988 that world temperature would rise 0.3C by 2000. Hansen projected 0.25 and 0.45C, averaging 0.35C. Outturn was 0.05C. I fairly said 0.3C and 0.1C. He says my source was a work of fiction by Michael Crichton. It wasn't: it was Hansen's graph.
He says I overlooked the difference between the immediate and delayed temperature response to changing conditions. In fact I expressly addressed it, citing evidence on both sides of the theory that the delayed air-temperature response arises from warming of the oceans.
He says I said the warming effects of carbon dioxide had been "made up". I didn't. I said all were agreed that there was more CO2 around and that we could expect some warming. But there is no consensus on how much.
He says I claimed to know better than the UN's scientists. I'm arrogant, George, but not that arrogant: I said the contrarians were probably a lot closer to the truth than the UN.
Too many facts wrong. Too much argument ad hominem instead of ad rem. Too much ignorance of the elementary physics of radiative transfer and equilibrium temperature. Still, gie the puir numpty a cigar - at least he spelled my name right.
Source
Gore gored
Below are some excerpts from Viscount Monckton's detailed reply to Al Gore. Gore's words are in italics. The full doc is here (PDF). Prof. Brignell also has some derisory comments on Gore's defence.
To begin with, there is a reason why new scientific research is peer-reviewed and then published in journals such as Science, Nature, and the Geophysical Research Letters, rather than the broadsheets.˜ The process is designed to ensure that trained scientists review the framing of the questions that are asked, the research and methodologies used to pursue the answers offered, and even, in some cases, to monitor the funding of the laboratories - all in order to ensure that errors and biases are detected and corrected before reaching the public.
There were some 90 references to learned papers in the scientific journals in the document supporting my article on the science of climate change that was posted on the Telegraph's website. This commentary, too, is supported by a substantial list of some 60 references to learned papers in journals including the three mentioned by Gore. The many journal references (hundreds more could have been cited) demonstrate that there is no scientific consensus that the effect of increased greenhouse-gas concentrations on the climate will be as serious as the UN's reports suggest. But I shall also take some references from the UN's assessment reports, with apologies that they are more political and less scientific than the papers in the journals. The Summaries for Policymakers at the head of each of the UN's reports are written not by scientists at all but by the political representatives of governments. There is repeated evidence of substantial and significant departures from the science in these political Summaries. In every instance, the discrepancies move in the direction of overstating and exaggerating the supposed problem even more than the scientific sections.
That level of scrutiny is typically not applied to newspaper columns of course, but since the stakes are so high in the debate over the climate crisis I would like to review here just a few of the misleading claims in Viscount Monckton's submissions to illustrate my belief that readers of The Telegraph should rely upon more reliable and authoritative sources than the Viscount for information on the latest climate science.
That level of scrutiny is typically not applied to books or films, of course, but since the stakes are so high in the debate over the climate "crisis" I should like to review here just a few of the misleading claims in Gore's film An Inconvenient Truth, to illustrate my belief that cinema-goers should rely upon more reliable and authoritative sources than Gore for information on the latest climate science. Here is Senator James Inhofe's list of some of Gore's scientific errors:
* Gore promoted the now-debunked "hockey stick" temperature chart for the past 1,000 years in an attempt to prove man's overwhelming impact on the climate, and attempted to debunk the significance of the mediaeval warm period and little ice age (for discussion and references, see below).
* Gore insisted on a link between increased hurricane activity and global warming that most sciences believe does not exist (for discussion and references, see below).
* Gore asserted that today's Arctic is experiencing unprecedented warmth while ignoring that temperatures in the 1930's were as warm or warmer (NCDC, 2006);
* Gore said the Antarctic was warming and losing ice but failed to note, that is only true of a small region and the vast bulk has been cooling and gaining ice (see my first article).
* Gore hyped unfounded fears that Greenland's ice is in danger of disappearing (for discussion and references, see below).
* Gore erroneously claimed that ice cap on Mt. Kilimanjaro is disappearing due to global warming, though satellite measurements show no temperature change at the summit, and the peer-reviewed scientific literature suggests that desiccation of the atmosphere in the region caused by post-colonial deforestation is the cause of the glacial recession (see my first article).
* Gore made assertions of massive future sea level rise that is way out side of any supposed scientific "consensus" and is not supported in even the most alarmist literature (for discussion and references, see below).
* Gore incorrectly implied that a Peruvian glacier's retreat is due to global warming, while ignoring the fact that the region has been cooling since the 1930s and other glaciers in South America are advancing (see Polissar et al., 2005, for an interesting discussion of glaciers in the tropical Andes).
* Gore blamed global warming for water loss in Africa's Lake Chad, though NASA scientists had concluded that local water-use and grazing patterns are probably to blame (Foley and Coe, 2001).
* Gore inaccurately said polar bears are drowning in significant numbers due to melting ice when in fact 11 of the 13 main groups in Canada are thriving, and there is evidence that the only groups that are not thriving are in a region of the Arctic that has cooled (Taylor, 2006).
* Gore did not tell viewers that the 48 scientists whom he quoted as having accused President Bush of distorting science were part of a political advocacy group set up to support the Democrat Presidential candidate, John Kerry, in 2004.
Gore is now an adviser to the UK Government on climate change.
First, Monckton claims that Dr. James Hansen of NASA said that the temperature would rise by 0.3C and that the sea level would rise by several feet.˜ But Hansen did not say that at all, and the claim that he did is extremely misleading. In fact, Dr. Hansen presented three scenarios to the U.S. Senate (high, medium, and low).˜ He explained that the middle scenario was "most plausible" and, as it turned out, the middle scenario was almost exactly right.˜
Hansen's three scenarios, presented to Congress during the very hot summer of 1988, projected global mean temperature increases of 0.3C, 0.25C and 0.45C respectively in the 12 years to 2000: an average of 0.33C. But 0.06C was the actual increase (NCDC, 2006). I fairly said 0.3C and 0.1C.
As to sea levels, I corrected this point in my second article. Mean sea level is difficult to measure. It probably rose by less than 1 inch between 1988 and 2000; the rate of increase - 1 inch every 15 years - has not risen for a century; and there is little reason to suppose that the rate of increase should accelerate. Morner (2004), who has spent a lifetime in the study of sea levels, provides an "official evaluation of the sea-level changes that are to be expected in the near future." He finds that "sea level records are now dominated by the irregular redistribution of water masses over the globe ... primarily driven by variations in ocean current intensity and in the atmospheric circulation system and maybe even in some deformation of the gravitational potential surface."
Morner says: "The mean eustatic rise in sea level for the period 1850-1930 was in the order of 1.0-1.1 mm/year," but that "after 1930-40, this rise seems to have stopped (Pirazzoli et al., 1989; Morner, 1973, 2000)."˜This stasis, in his words, "lasted, at least, up to the mid-60s."˜Thereafter, "the record can be divided into three parts: (1) 1993-1996 with a clear trend of stability, (2) 1997-1998 with a high-amplitude rise and fall recording the ENSO event of these years and (3) 1998-2000 with an irregular record of no clear tendency."˜Most important of all, in his words, "There is a total absence of any recent `acceleration in sea level rise' as often claimed by IPCC and related groups."
He concludes: "When we consider past records, recorded variability, causational processes involved and the last century's data, our best estimate of possible future sea-level changes is +10 +/- 10cm in a century, or, maybe, even +5 +/- 15cm." See also Morner (1995); INQUA (2000).
Van der Veen (2002) intended "to evaluate the applicability of accumulation and ablation models on which predicted ice-sheet contributions to global sea level are based, and to assess the level of uncertainty in these predictions arising from uncertain model parameters."˜He concluded that "the validity of the parameterizations used by glaciological modeling studies to estimate changes in surface accumulation and ablation under changing climate conditions has not been convincingly demonstrated."
Munk (2003) says: "Surveys of glaciers, ice sheets, and other continental water storage can place only very broad limits of -1 to +1 mm/year on sea level rise from freshwater export." It is not known how the cryosphere will respond to global warming.˜
Braithwaite and Raper (2002) analyze mountain glaciers and ice caps, excluding the Greenland and Antarctic ice sheets.˜ They begin by saying: "The temperature sensitivity of sea level rise depends upon the global distribution of glacier areas, the temperature sensitivity of glacier mass balance in each region, the expected change of climate in each region, and changes in glacier geometry resulting from climate change."˜ They end by reporting that "None of these are particularly well known at present," and they conclude that "glacier areas, altitudes, shape characteristics and mass balance sensitivity are still not known for many glacierized regions and ways must be found to fill gaps."
Monckton goes on to level a serious accusation at all the scientists involved in the Intergovernmental Panel on Climate Change, claiming that they have "repealed a fundamental physical law" and as a result have misled the people of the world by exaggerating the sensitivity of the Earth's climate to extra carbon dioxide.˜If this were true, the entire global scientific community would owe Monckton a deep debt of gratitude for cleverly discovering a gross and elementary mistake that had somehow escaped the attention of all the leading experts in the field.
Here and elsewhere, I shall not respond to ad hominem remarks, but shall comment only ad rem. As will be shown below, the shortfall between the observed 20th-century temperature increase of 0.45 to 0.6C and the 20th-century increase of 1.6 to 3.75C that would have been expected from the projections made by the models upon which the UN relies is unwarranted either in the laws of physics or in the 20th-century global mean surface air temperature record. This shortfall between reality and the UN's projections is well established in the scientific literature (see, for instance, Hansen, 2006), though until my article was published it was not known to the public. There is certainly no scientific consensus on the reason for the very substantial discrepancy. Some, such as the Hadley Centre (IPCC 2001, quoted by Lindzen, 2006) blame pollutant aerosols for reflecting some of the Sun's radiance back to space. Others (such as Barnett, 2005, or Levitus, 2005), say the oceans are acting as a heat-sink. If there is in fact no good reason for the discrepancy between reality and projection, and if - as I am by no means alone in thinking - the UN's models are simply over-projecting the likely temperature effects of elevated greenhouse gas concentrations, then the UN's projections of future temperature increases may be around three times greater than they should be.
But again, this charge is also completely wrong, and it appears in this case to spring from the Viscount's failure to understand that these complex, carefully constructed supercomputer climate models not only have built into them the physical law he thinks he has discovered is missing, but also many others that he doesn't mention, including the fundamentally important responses of water vapor, ice and clouds that act to increase the effects of extra carbon dioxide.
The laws of physics say the increase in temperature is 0.3C for every additional watt per square metre of temperature. The UN says 0.5C (IPCC 2001). Several physicists have confirmed my result, which readers may like to check for themselves using a scientific calculator.....
Both in my article and in the supporting discussion document and calculations, I explicitly mentioned climate feedbacks from water vapour and ice-melt. I did not mention climate feedbacks from clouds because, as the UN itself says, even the direction of the change in radiative forcing and hence in temperature caused by clouds is not known (IPCC 2001). I explained that the UN's reason for using a figure nearly twice what the laws of physics mandate for the increase in temperature for each watt of additional forcing was to incorporate an allowance for climate feedbacks.
However, I demonstrated that, if one assumed that the UN's positive climate feedbacks were matched by negative feedbacks, the observed climate response over the 98 years 1900-1998 was identical to the climate sensitivity projected by use of the UN's greenhouse-gas forcing equation. In short, there is no direct observational evidence in the 20th-century global mean surface air temperature record that any allowance at all should be made for climate feedbacks in response to temperature increases arising from elevated greenhouse-gas concentrations in the atmosphere. As will be seen, the implications for forward projections of temperature increase are substantial.
Moreover, direct observations from the 20th century, from the last ice age and from the atmosphere's response to volcanic eruptions, all give estimates of the earth's sensitivity to extra CO2 that are exactly in line with model results (around a 3 degrees Celsius warming for a doubling of the CO2 concentration).
The UN gives observed centennial temperature change as 0.6C, equivalent to 1.98wm-2. So projected figure of 5.36wm-2 derived from the UN's model results using the UN's own formula and coefficients projects a sensitivity to extra CO2 that is not exactly or even approximately in line with observation, but is in fact 2.7 times greater than what was actually observed.
Direct observations from the last ice age
Direct observations from the last ice age were not possible. We were not here. Temperatures and CO2 concentrations have been indirectly deduced from samples of air from former ages locked in the ice of Greenland or Antarctica. The results do not provide a basis for reliable estimates of the earth's sensitivity to extra CO2: they show that increases in CO2 do not precede increases in temperature - they follow it.
Petit et al. (1999) reconstructed surface air temperature and atmospheric CO2 concentration profiles from Vostok ice core samples covering 420,000 years, concluding that during glaciation "the CO2 decrease lags the temperature decrease by several thousand years" and "the same sequence of climate forcing operated during each termination."
Using sections of ice core records from the last three inter-glacial transitions, Fischer et al. (1999) decided that "the time lag of the rise in CO2 concentrations with respect to temperature change is on the order of 400 to 1000 years during all three glacial-interglacial transitions."
On the basis of atmospheric carbon dioxide data obtained from Antarctic Taylor Dome ice core samples, and temperature data obtained from the Vostok ice core, Indermuhle et al. (2000) looked at the relationship between these two variables over the period 60,000-20,000 years ago. A statistical test on the data showed that movement in the air's CO2 content lagged behind shifts in air temperature by approximately 900 years, while a second statistical test yielded a mean lag-time of 1200 years.
Similarly, in a study of air temperature and CO2 data obtained from high time resolution samples at the Antarctic Concordia Dome site, for the period 22,000-9,000 ago, covering the last glacial-to-interglacial transition, Monnin et al. (2001) found that the start of the CO2 increase lagged the start of the temperature increase by 800 years.
In yet another study of the 420,000-year Vostok ice-cores, Mudelsee (2001) concluded that variations in atmospheric CO2 concentration lagged behind variations in air temperature by 1,300 to 5,000 years.
In a study using different methodology, Yokoyama et al. (2000) analyzed sediments in the tectonically stable Bonaparte Gulf of Australia to determine the timing of the initial melting phase of the last great ice age.
Commenting on the results of that study, Clark and Mix (2000) note that the rapid rise in sea level caused by the melting of land-based ice that began approximately 19,000 years ago preceded the post-glacial rise in atmospheric CO2 concentration by about 3,000 years.
Caillon et al. (2003) focused on an isotope of argon (40Ar) that can be taken as a climate proxy, thus providing constraints about the relative timing of CO2 shifts and climate change. Air bubbles in the Vostok ice core over the period that comprises Glacial Termination III - which occurred 240,000 years ago - were studied. They found that "the CO2 increase lagged behind Antarctic deglacial warming by 800 ~ 200 years."
We conclude that there is plentiful evidence in the scientific literature that increases in atmospheric CO2 have followed increases in temperature in former ages and cannot have been the cause of those increases. In this respect, ice-core studies can tell us no more than that there may be a small climate feedback from increased atmospheric CO2 in response to temperature.
Direct observations of the atmosphere's response to volcanic eruptions
The most recent major volcanic eruption to have been observed directly was that of Mount Pinatubo, in the Philippines, in June 1991. Sassen (1992) reported that cirrus clouds were produced during the eruption, Lindzen et al. (2001) proposed that cirrus clouds might provide a possible negative feedback that might partially counteract the positive feedbacks assumed in the UN's climate feedback factor.
Douglass and Knox (2005) considered this negative climate feedback in some detail: "We determined the volcano climate sensitivity and response time for the Mount Pinatubo eruption, using observational measurements of the temperature anomalies of the lower troposphere, measurements of the long wave outgoing radiation, and the aerosol optical density." They reported "a short atmospheric response time, of the order of several months, leaving no volcano effect in the pipeline, and a negative feedback to its forcing."
They also note that the short intrinsic climate response time they derived (6.8 ~ 1.5 months) "confirms suggestions of Lindzen and Giannitsis (1998, 2002) that a low sensitivity and small lifetime are more appropriate" than the "long response times and positive feedback" assumed in the UN's models. They conclude that "Hansen et al.'s hope that the dramatic Pinatubo climate event would provide an `acid test' of climate models has been fulfilled, although with an unexpected result."
Conclusion
We conclude, on the basis of a study of the UN's own reports and of the academic literature in the peer-reviewed scientific journals, that the UN may have failed to take negative climate feedbacks sufficiently into account, there is no consensus among climate scientists on any of the three classes of evidence for the UN's estimate of climate sensitivity cited by Gore, and that in all three classes - 20th-century observation, palaeoclimatological reconstruction and studies of volcanic eruption - there is recent, frequent and compelling evidence in the scientific literature that raises serious questions about the validity of the "consensus" position.
And, despite Viscount Monckton's recycled claims about the so-called "hockey stick" graph (an old and worn-out hobby horse of the pollution lobby in the U.S.), this faux controversy has long since been thoroughly debunked. The global warming deniers in the U.S. were so enthusiastic about this particular canard that our National Academy of Sciences eventually put together a formal panel, comprised of a broad range of scientists including some of the most skeptical, which vindicated the main findings embodied in the "hockey stick" and definitely rejected the claims Monckton is now recycling for British readers.
No. In fact the committee of the National Research Council, (North et al., 2006), which answers to the National Academies of Sciences and of Engineering, while confident that today's temperatures are warmer than at any time in the past 400 years, was "less confident" about the UN "hockey-stick" graph's abolition of the mediaeval warm period, because of a lack of data before 1600 AD. The committee's report criticized the methodology of the authors of the "hockey-stick", The committee notes explicitly, on pages 91 and 111, that the method used in compiling the UN's "hockey-stick" temperature graph has no validation skill significantly different from zero. Methods without a validation skill are usually considered useless.
Similar grounds for concern were listed in a report by three independent statisticians for the US House of Representatives (Wegman et al., 2005), who found that the calculations behind the "hockey-stick" graph were "obscure and incomplete". Criticisms of the hockey-stick summarized in my article came from papers in the learned journals: e.g. McIntyre and McKitrick (2005). Wegman et al. (2005) found these criticisms "valid and compelling". It found that the scientists who had compiled the graph had not used statistical techniques properly, and found no evidence that they had "had significant interactions with mainstream statisticians". It found that the scientists' "sharing of research material, data and results was haphazardly and grudgingly done." It found that the peer review process, by which other scientists are supposed to verify learned papers before publication, "was not necessarily independent". Finally, it found that the "hockey-stick" scientists' "assessments that the decade of the 1990s was the hottest decade of the millennium and that 1998 was the hottest year of the millennium cannot be supported by their analysis". It recommended that State-funded scientific research should be more carefully and independently peer-reviewed in future, not only by the learned journals but also by the UN's climate change panel. It recommended that authors of the UN's scientific assessments should not be the same as the authors of the learned papers on which the UN relies; that State-funded scientists should make their data and calculations openly and promptly available; and that statistical results by scientists who were not statisticians should be peer-reviewed by statisticians.
The NAS stated that the late 20th century warming in the Northern Hemisphere was unprecedented during at least the last 1,000 years and probably for much longer than that. They also noted that the finding has "subsequently been supported by an array of evidence."
No. In fact, North et al. (2006) said this: "Less confidence can be placed in proxy-based reconstructions of surface temperatures for A.D. 900 to 1600, although the available proxy evidence does indicate that many locations were warmer during the past 25 years than during any other 25-year period since 900. ˜Very little confidence can be placed in statements about average global surface temperatures prior to A.D. 900 because the proxy data for that time frame are sparse." These quotations, taken from an executive summary signed by all members of the committee that prepared the report, bear no relation to what Gore says they said.
As to the "array of evidence" supporting the "hockey-stick" graph's conclusion that there was no mediaeval warm period - a conclusion which could not be properly drawn from the methodology used to produce the graph itself - Wegman et al. (2005) said: "In our further exploration of the social network of authorships in temperature reconstruction, we found that at least 43 authors have direct ties to [the graph's lead author] by virtue of coauthored papers with him. Our findings from this analysis suggest that authors in the area of paleoclimate studies are closely connected and thus `independent studies' may not be as independent as they might appear on the surface."
So, no matter how many charts or graphs the Viscount might want to create, the basic facts remain the same. What the models have shown, unequivocally, is that carbon dioxide and other greenhouse gases mainly released from industrial activities are warming the planet.
My first article said: "There are more greenhouse gases in the air than there were, so the world should warm a bit, but that's as far as the `consensus' goes." There is no consensus at all on how much warming there will be, or about whether or when it will be dangerous. Models are of theoretical interest, but they are not definitive. Until recently they contained "flux adjustments" - or fudge-factors - many times larger than the very small changes in tropospheric radiant energy that are at issue.
Computer models are not capable of showing anything "unequivocally": they are suitable only for making projections, which may or may not prove reliable. The models upon which the UN so heavily relied failed to predict either the timing or the magnitude of the El Nino Southern Oscillation event in 1998. More recently they have failed to predict the sharp cooling of the climate-relevant surface layer of the ocean that has occurred in the past two years (Lyman, 2006).
Sixty Canadian scientists expert in climate and related fields, writing to the Canadian Prime Minister earlier this year (Canada, 2006) said: "Observational evidence does not support today's computer climate models, so there is little reason to trust model predictions of the future."
Dr. Vincent Gray, a research scientist and a reviewer working on the UN's 2001 report (IPCC, 2001) has noted, "The effects of aerosols, and their uncertainties, are such as to nullify completely the reliability of any of the climate models."
Freeman Dyson, an eminent physicist, said this in a talk to the American Physical Society (Dyson, 1999): "The bad news is that the climate models on which so much effort is expended is unreliable. The models are unreliable because they still use fudge-factors rather than physics to represent processes occurring on scales smaller than the grid-size. . The models fail to predict the marine stratus clouds that often cover large areas of ocean. The climate models do not take into account the anomalous absorption of radiation revealed by the Atmospheric Radiation Measurements. This is not a small error. If the ARM are correct, the error in the atmospheric absorption of sunlight calculated by the climate models is about 28 watts per square metre, averaged over the whole Earth, day and night, summer and winter. The entire effect of doubling the present abundance of carbon dioxide is calculated to be about four watts per square metre. So the error in the models is much larger than the global warming effect that the models are supposed to predict. Until the ARM were done, the error was not detected, because it was compensated by fudge-factors that forced the models to agree with the existing climate. Other equally large errors may still be hiding in the models, concealed by other fudge-factors. Until the fudge-factors are eliminated and the computer programs are solidly based on local observations and on the laws of physics, we have no good reason to believe the predictions of the models. . They are not yet adequate tools for predicting climate. . We must continue to warn the politicians and the public, `Don't believe the numbers just because they come out of a supercomputer.'"
Eugene Parker, a leading solar physicist, has said: "The inescapable conclusion is that we will have to know a lot more about the Sun and the terrestrial atmosphere before we can understand the nature of the contemporary changes in climate. . In our present state of ignorance it is not possible to assess the importance of individual factors. The biggest mistake that we could make would be to think that we know the answers when we do not" (Parker, 1999).
Scientists have also carefully examined the real world evidence (temperature change as measured by air balloons, ground and satellite measurements, proxies like ice cores and tree rings, for example) and have found that the models do indeed match the observations.
Until last year, the observations did not even match each other. NASA (2005) said the trend in satellite measurements of the lower troposphere (from the surface to about 5 miles up) was just 0.08C per decade since 1979, but the trend in surface temperature measured on the ground (NCDC, 2006) is twice that, 0.16C per decade in the same period. NASA (2005) commented: "These differences are the basis for discussions over whether our knowledge of how the atmosphere works might be in error, since the warming aloft in the troposphere should be at least as strong as that observed at the surface." More recently, however, NASA has found that its satellite sensors had been pointing in the wrong direction. Satellite tropospheric temperature trends now accord with those at the surface. Balloon temperatures were also out of alignment with both surface and satellite temperatures for many years. Recently, however, a correction has been made to the handling of the data and they now conform.
Furthermore, the fact of warming does not tell us its cause. Though carbon dioxide and other greenhouse gases are likely to be a contributing factor, they are not likely to be the only factor, and may not even be the main one. Even if greenhouse gases are the sole factor, there is no consensus about the UN's projected warming trend for the future. Besides, as we have shown, the models do not match the observed change in temperature, the discrepancy is large, and there is no consensus either about the reason for the discrepancy or about whether the discrepancy is real.
It is important to understand that there is not just one single strand of evidence leading us to believe that global warming is occurring, but rather that all of the peer-reviewed evidence, from scientists around the world, points in the same direction.
Mr. Gore says that all of the peer-reviewed evidence points in the same direction. A very large proportion of it points in the opposite direction, as the papers listed here make plain. For instance, Soon and Baliunas (2003) listed some 240 scientific papers in which a period of at least 50 years of anomalous drought, rainfall or temperature were indicated at some time during the mediaeval warm period. The authors of the "hockey-stick" graph angrily dismissed Soon and Baliunas (2003) as irrelevant, but - whatever the paper's faults - it demonstrates that the "consensus" repeatedly claimed by the UN and its supporters is far from real.
To be sure, not all of the finest workings of the climate system are yet fully understood to the finest grain. However, all of the basics are absolutely clear.˜ Global warming is real, human activities are causing the problem, many of the solutions are available to us now, it is not too late to avoid the worst, and all we need to get started solving the crisis is the political will to act.
"Global Warming Is Real", says Gore. Sixty leading climatologists and scientists in related fields wrote to the Canadian Prime Minister (Canada, 2006): "Climate Change Is Real" is a meaningless phrase used repeatedly by activists to convince the public that a climate change catastrophe is looming and humanity is the cause. Neither of these fears is justified. Global climate changes occur all the time due to natural causes, and the human impact still remains impossible to distinguish from the natural `noise'."
For the third time Gore recites the already-agreed fact of warming. However, there is no consensus on whether or to what degree human activities are causing "the problem", or even whether there is a problem. Global cooling, widely predicted in the 1970s, would have been much more dangerous than warming. The unusual hot weather in mainland Europe killed 3,000 elderly Frenchmen a couple of years ago. Like so many other events, it was blamed on global warming but was not caused by manmade climate change. It arose from natural climate variability. The most recent cold snap in the UK killed 25,000 people.
This is what prompted the national academies of science in the 11 most influential nations on the planet to come together to jointly call on every nation to "acknowledge that the threat of climate change is clear and increasing." They added that the "scientific understanding of climate changes is now sufficiently clear to justify nations taking prompt action."
The "scientific understanding" is so crude that the central question - by how much can the temperature be expected to rise as a result of a given additional amount of greenhouse gas in the atmosphere - has not been definitively established either empirically or theoretically. It has been established by laboratory experiment that increased CO2 concentrations can cause additional scattering of outgoing longwave radiation at the tropopause, but not at or near the surface, and only at the fringes of one of the three principal absorption bands of CO2. It has been established that the stratosphere is cooling, suggesting that less outgoing radiation is emerging from the tropopause. But it is insufficiently clear whether or to what extent the temperature increase since 1900 is attributable to anthropogenic as opposed to natural factors, and it is not even clear by how much the temperature rose between 1900 and 1998 (NCDC US global mean temperature anomaly 0.3C, AccuWeather from land-based stations 0.45C, NCDC global mean 0.53C; UN 0.6C).
***************************************
Many people would like to be kind to others so Leftists exploit that with their nonsense about equality. Most people want a clean, green environment so Greenies exploit that by inventing all sorts of far-fetched threats to the environment. But for both, the real motive is to promote themselves as wiser and better than everyone else, truth regardless.
Global warming has taken the place of Communism as an absurdity that "liberals" will defend to the death regardless of the evidence showing its folly. Evidence never has mattered to real Leftists
Comments? Email me here. My Home Pages are here or here or here. For times when blogger.com is playing up, there are mirrors of this site here and here.
*****************************************
Thursday, November 23, 2006
CLIMATE CHANGE HAS GONE 'FROM A SCIENCE TO A RELIGION'
A northern Alberta geologist has embarked on a crusade to stop what he says is the madness of the prevailing wisdom that human activity is heating the Earth. "The truth has to start somewhere," said Bruno Wiskel in an interview with the Sun yesterday. Wiskel, who teaches a University of Alberta faculty of extension course, says climate change is an eons-old force that has nothing to do with people. Current global warming, he said, has been going on for about 18,000 years, with glaciers retreating and sea levels rising ever since. "If this happened once and we were the cause of it, that would be cause for concern," said Wiskel. "But glaciers have been coming and going for billions of years."
Wiskel's comments came a day after opposition MPs and environmentalists blasted as inadequate Canada's efforts to combat global warming. A Bonn-based development group, Germanwatch, placed Canada 51st out of 56 countries that were assessed for their performance and policies on climate change.
Wiskel says climate change has gone "from a science to a religion" that preaches carbon dioxide from human activity is to blame for increasing temperatures - something with which he soundly disagrees. He blamed people grubbing for research dollars for perpetuating what he says is a myth. "If you funnel money into things that can't be changed, the money is not going into the places that it is needed."
Wiskel, touting his latest book The Emperor's New Climate: Debunking the Myth of Global Warming, teaches a U of A course called Building an Energy Efficient Home for Less. He started to research climate change while building a "Kyoto house" in which he now lives near Athabasca, about 150 km north of Edmonton. He claims his house is 5,500 square feet and uses less than 10% of the natural gas that a regular home in Edmonton would use. In building the house, he says, he was seeking to prove that Kyoto Protocol targets could be met by people making small changes in their lives, without touching industry. Instead, he said he realized global warming theory was full of holes and "red flags," and became convinced that humans are not responsible for rising temperatures.
Source
Every silver lining has a cloud
A freelance science writer asks why greens seem so opposed to one scientist’s proposal for stabilising global temperatures
Little is certain in the field of global climate prediction. But one thing is for sure: if all those worst-case scenarios made so much of by environmentalists come true, we really are screwed. So you might expect those same environmentalists to be rather excited by a project that claims to be able to stabilise global temperatures at the push of a button, and keep them stable while the world makes the transition to energy sources of the future. Except that they’re not. In fact, if their reaction to the project is anything to go by, either they don’t believe their own press releases, or trying out new things in order to save the planet is not one of their top priorities.
There has been no shortage of suggestions over recent decades for large-scale ‘engineering fixes’ for global warming, some more outlandish than others. They have ranged from seeding the oceans with iron filings to draw down atmospheric CO2, to the launching of billions of aluminised balloons to reflect the sun’s rays away from the Earth, to the installation of giant mirrors in space that intercept those rays before they reach us. Atmospheric physicist John Latham’s idea is perhaps more down-to-Earth than most, although whether it can provide a ‘solution’ to climate change remains very much up for debate. In the 1980s, Latham, professor emeritus at Manchester University, and now at the National Center for Atmospheric Research in Colorado, realised that the Earth already had the hardware in place for reflecting sunlight back into space.
While some types of cloud have an insulating effect on the planet, others, such as the low-altitude stratocumulus variety that covers much of the world’s oceans, reflect incoming sunlight. Latham’s idea, which he first published in the science journal Nature in 1990, is to make the silver linings of those stratocumulus clouds a little bit more silvery, by injecting salt crystals into the atmosphere to seed the formation of the water droplets that comprise them. In this way, he claims, ‘one can produce a degree of cooling in a controlled way, to try and balance the warming produced by the burning of fossil fuels’. He calculates that to achieve the desired effect on cloud reflectivity would require treating them with ‘a cupful’ of salt per km2 per hour.
‘It’s a very interesting idea, and one that is based on sound cloud physics’, says Alan Gadian, climate scientist at the University of Leeds. He is impressed that, because the technique would be augmenting a natural process (breaking waves are constantly throwing vast quantities of salt up into the atmosphere), it carries relatively little risk. And should things go awry, he says, ‘you could just stop producing these salt crystals and the system would return to its normal state’. John Shepherd, director of the University of Southampton’s Earth System Modelling Initiative, agrees. ‘In principle, the idea is sound’, he says. ‘The big question is whether they can get enough sea salt nuclei into the atmosphere.’
And that’s down to Stephen Salter, professor of engineering at the University of Edinburgh, who is best known for his invention of ‘Salter’s duck,’ a device for harnessing energy from waves. For the current project, he has designed a fleet of specialised ocean-going yachts. ‘They’ll look like steam ships with big funnels’, he says. But these are no ordinary funnels. They will be spinning rapidly on their vertical axis, a feature that serves two important functions.
The first is propulsion. When wind hits a spinning cylinder, it generates a sideways thrust. As well as allowing the boats to be positioned optimally, this force would propel them fast enough to drive a water turbine that powers the conversion of seawater into a very fine mist. As the mist rises, the water evaporates from the droplets to leave the airborne salt crystals. To do their job, the crystals must be within a narrow size range, which means producing droplets that are consistently about one millionth of a metre in diameter. This will involve vibrating the surface of a seawater reservoir to create a network of fine ripples. ‘If you make these ripples big enough, drops are thrown off’, says Salter. The size of those drops is determined by the frequency of the vibrations.
And there lies another technical challenge. To produce the ripples, the surface of the seawater reservoir must be smooth – not easy to achieve on a pitching, rolling boat. This is where the spinning funnels really come into their own. They will be filled with seawater, which gets thrown against the walls by centrifugal force, producing a smooth, vertical surface on which the ripples can be generated. Fans inside the funnels will then blow the resulting mist up into the sky like smoke rising from a chimney.
The yachts will carry no crew, but will be controlled via satellite. Salter estimates that a fleet of up to 40,000 of these hi-tech Mary Celestes would be required to offset the temperature rise predicted to result from a doubling in atmospheric CO2. Even if CO2 concentrations were to increase according to worst-case scenarios, this, he estimates, would provide several decades’ respite – which might provide time to develop non-carbon energy sources; research the intricate workings of climate systems; and plan long-term strategies to cope with a changing climate.
It would also be relatively cheap. ‘I can’t see these things being more than a million quid a go’, says Salter. That still adds up to £40billion. However, the investment would be spread over the time it takes for CO2 to double. ‘You’d only need to spend perhaps three per cent of that every year to stabilise things’, says Salter. ‘That would be an incredible bargain.’ Indeed, it is a tiny fraction of the expense of the Kyoto Protocol, for example, which is expected to shave off just a few tenths of a degree of temperature rise over the next hundred years.
Stabilisation of global temperatures? Little risk? At a fraction of the cost of Kyoto? It sounds like it at least worth trying, and it sounds like an environmentalist’s wet dream. So why are green organisations so unimpressed with the idea? ‘It’s one of those crazy engineering solutions to climate change that we ignore really’, says Friends of the Earth (FoE) climate campaigner Bryony Worthington. ‘It’s not something we think we should be spending money and time on.’ Worthington denies she’s being dismissive. ‘It’s not a question of being dismissive; it’s a question of whether this is worth any time and effort even thinking about.’
Over at Greenpeace, Mark Strutt, who was until recently senior climate campaigner at Greenpeace UK (he’s now Greenpeace International’s agriculture spokesperson), takes a similar stance. ‘Greenpeace wouldn’t be interested in this sort of thing. We’re looking for reductions in the use of fossil fuels rather than these technologies that in all likelihood would come to nothing.’
Of course, the project might indeed come to nothing. There are good reasons to think that we cannot control the climate – a chaotic system influenced by a host of inputs – by tweaking a single variable. And yet tweaking a single variable – CO2 emissions – is precisely what environmentalists are themselves urging us to do. However, the environmentalist case against engineering fixes for global warming does not rest on the underlying science. It has more to do with a view of science as the cause of the world’s problems, and not something that might provide a solution. ‘We don’t take these ideas very seriously because the idea that we’ll somehow come up with a man-made fix is fanciful’, says Worthington. This sentiment is echoed by Charlie Kronick, Greenpeace UK’s climate change coordinator. ‘The idea of interfering with another natural system to compensate for the nearly catastrophic interference we’ve already done is not an enticing prospect’, he says.
Despite these seemingly Luddite sentiments, Worthington claims to have science on her side. ‘The models are showing that reducing the concentrations of greenhouse gases is the only sensible response to climate change.’ Really? Latham has been collaborating with the UK Meteorological Office to test the theory behind his project using their powerful computer model of global climate. This suggested that treating clouds covering just three per cent of the Earth’s surface would cool the planet sufficiently to compensate for a doubling of CO2. Alan Gadian is sufficiently impressed that he is now embarking on a project to replicate that study.
It is at this point that Worthington is forced to express her discomfort with the very models on which the environmental case depends. ‘But he can’t be certain’, she says, ‘they’re only models.’ Yes, and green activists’ predictions of climate change disaster are also based on models.
There may be other reasons for FoE and Greenpeace’s discomfort with such projects. After all, a successful engineering fix would deprive the green movement of its most valuable political currency – urgency. If the world were to have a few decades of stable temperatures, the urgency of green politics would have to give way to a genuine, rational political debate. Their discomfort also points to a lack of faith in man-made solutions; we are seen as giving rise to climate chaos and thus must apparently take a hands-off approach from nature.
Engineering the climate might yet prove impossible, for scientific or practical reasons. Latham’s team is now planning a small-scale pilot experiment further to explore the project’s viability. ‘We don’t know yet what fraction of the drops we make will actually get up to where the clouds are’, says Salter. But there is surely something noble about the aspiration to control the climate. We don’t need climate models to tell us that Mother Nature has plenty to throw at us, whether or not the planet warms as predicted. And in that respect, projects such as Latham’s could be seen as valuable developments, regardless of whether the elements have even more nasty surprises in store for us.
No doubt environmentalist groups would abhor the prospect of controlling the Earth’s climate on the basis that, in the words of Kronick, we’d be interfering in a ‘natural system’. Environmentalists’ aspirations are very different: through rain or shine, they seem determined to stick to the mantra that we should be reducing CO2 emissions and, in doing so, leave us even more vulnerable to the whim of Mother Nature. Worthington and Strutt both claim that the search for engineering fixes for global warming only serves as a distraction, making people and governments less inclined to reduce CO2 emissions. And yet Worthington herself doesn’t seem to have much faith that reducing emissions will be particularly effective: ‘If we can see global CO2 emissions peak and decline in the next 10 to 15 years, we’ve still got a slim chance of holding [temperature increases] down to two degrees’, she says.
A slim chance of avoiding climate catastrophe? Environmentalists, it seems, don’t need any help when it comes to disinclining the world to reduce carbon emissions.
Source
CLIMB-DOWN: EU SAYS RADICAL CHANGES TO EMISSIONS TRADING SCHEME WILL WAIT UNTIL 2013
And that the scheme so far has done little
The European Commission said Monday that any radical changes to its carbon dioxide emissions trading program would have to wait until 2013. The program includes a plan to bring airlines into the scheme and link up with trading in other parts of the world - including several U.S. states. It said it wanted to expand the scheme to new sectors and gases, giving few details beyond mentioning aviation and methane released from coal mining and nitrous oxide from ammonia production. It would also examine how it could count more carbon capture initiatives.
In a report, the EU executive suggested a single EU cap on emissions after 2012, replacing 25 separate targets put forward by each EU nation. The report said the EU would look into similar trading programs in other countries and will see how they could link up with the European Union. Several U.S. northeastern states have formed an initiative to cut carbon dioxide emissions, and California is moving in the same direction. However, formal plans will only be put forward in late 2007 after experts report back next June, it said.
The EU report acknowledged that the first years of the scheme have been disappointing as some governments gave out too many allocations, meaning industry made few real efforts to cut back. "Robust compliance and enforcement" is needed, it said, including independent checks on emissions reports. On paper, the scheme was a success last year as less emissions were released than expected. But the report discounted that, blaming targets that were too high. "However to the extent that it reflects an overestimate of baseline emissions, it means that the environmental outcome of the scheme in the first period will not be as large as it could have been or as large as will be necessary to adequately address climate change," it said.
The commission is fine-tuning plans for the second stage of the program that will run from 2008 to 2013.
Source
DARN DROUGHT DATA
We have all heard the news that droughts will certainly become longer, more frequent, and more severe thanks to global warming. Higher temperatures will surely increase rates of potential evapotranspiration, and even if precipitation patterns remain unchanged, the odds will favor more droughts in the future. The Intergovernmental Panel on Climate Change (IPCC) states in the 2001 Summary for Policymakers that it is "Likely" that "Increased summer continental drying and associate risk of drought" has occurred in the later half of the 20th century and "Likely, over most mid-latitude continental interiors" to occur during the 21st century.
Figure 1 below shows the current state of affairs as of November 4, 2006, and generally, widespread drought in the mid-latitude continental interior is absent. In fact, as we look at the Great Plains, we find more areas in the "Extremely Moist" category than the "Extreme Drought" category. We would all agree that one snapshot of soil moisture conditions in the United States is not an adequate way to test the idea that global warming will lead to an increase in drought in mid-latitude continental interiors. What is needed, of course, is a longer perspective with drought information over hundreds of years.
Our wish for longer term information on drought in the United States has come true given a recent article in The Holocene. Celine Herweijer and her associates at the Lamont-Doherty Earth Observatory at Columbia University used a combination of proxy data (e.g., tree-ring data), historical accounts, limited instrumental records, and climate models to reconstruct the drought patterns of the past. Not surprisingly, they found "The two major long-lasting droughts of the 1930s and 1950s covered large areas of the interior and southern states and have long served as paradigms for the social and economic cost of sustained drought in the USA. Both had severe environmental and social impacts, in the Great Plains and southwest, respectively." Note that the two major drought periods occurred 50 to 70 years ago, long before the celebrated global warming of the last three decades.
The team states "These events are not unique to the twentieth century" and that "three distinct periods of widespread and persistent drought stand out in these records for the latter half of the nineteenth century: 1856-1865, 1870-1877 and 1890-1896." Note that these three drought periods occurred during the Little Ice Age which was anything but a period of warmer temperatures. Furthermore, Herweijer et al. note that "Analysis of mid- to late-nineteenth century instrumental and proxy records from the tropical Pacific reveal prolonged La Nina-like conditions during each of the persistent droughts:1856-1865, 1870-1877 and 1890-1896." In case you have forgotten, El Nino is the condition that is associated with warm water in the eastern Pacific and La Nina is a period with exceptionally cold water in the eastern Pacific. So the droughts of the 19th century not only occurred during a cold century, but they occurred in relatively cold periods of that century (Figure 2).
The team expands on this link to cold sea-surface temperatures (SSTs) stating "It is well known that changes in the configuration of tropical SSTs on interannual timescales can strongly influence extratropical precipitation: during La Nina winters there is reduced precipitation across much of the northern subtropics and mid-latitudes, with large deficits in particular in the southwest USA, extending into the Great Plains" and that "persistent drought conditions in the Great Plains were primarily influenced by the tropical part of the SST forcing, with a tendency for drought when the tropical Pacific SSTs are cold." They also note that "During each of the mid- to late-nineteenth century droughts, the upper tropospheric geopotential heights are lowered in the tropics consistent with cooling at these latitudes."
Next, the team explored droughts that may have occurred 1,000 years ago during what they called the Mediaeval period (not to be confused with the current Media Evil period). Coral provide proxy information about the past sea surface conditions, and they used a coral-based reconstruction to demonstrate "the potential link between a colder eastern equatorial Pacific and the persistent North American droughts of the Mediaeval period." They found "that the present multiyear drought in the western USA pales in comparison with a 'Mediaeval Megadrought' that occurred from AD 900 to AD 1300. This drought reconstruction also shows an abrupt shift to wetter conditions after AD 1300, coinciding with the 'Little Ice Age', a time of globally cooler temperatures, and a return to more drought-prone conditions beginning in the nineteenth century."
It becomes obvious that major droughts occur during warm and cold periods, but the evidence suggests that relatively cold periods in the tropical Pacific control prolonged droughts in the United States, whether at present, during the Little Ice Age, or during the Mediaeval Warm Period 1,000 years ago.
Since some climate models suggest El Nino will be more frequent than La Nina in the future, perhaps the outlook for future droughts is not so dreary!
Source
The truth about Australia's latest drought
By economist Ross Gittins. He doesn't even mention global warming, funnily enough
Talking to farmers about drought is like talking to fishers about the one that got away. This one is always much bigger than those that went before. And since the hyperbole merchants told us the drought of 2002 was the biggest in 100 years, this one must be the biggest in 1000 years. Yeah, sure. Thank goodness for the assessments of narky economists, who don't try to humour farmers the way ingratiating politicians and a superlative-seeking media do.
The Reserve Bank offered a dispassionate assessment of the likely severity of the drought in a statement last week. It's pretty bad, but not as cataclysmic as some would have us believe. The severity of droughts can be judged in different ways. One way is to compare the share of the nation's prime agricultural land suffering deficient rainfall this year with previous years. By that measure this one seems less severe than the droughts at the time of Federation, in the 1940s and early 1980s and in 2002. It's significant, however, that this drought comes so hard on the heels of the 2002 drought, thus limiting the opportunities for recovery in growing conditions and water storage. One way to account for this factor is to take for each year the average degree of drought-affected land during the previous five years. Measured this way, the area of land with deficient rainfall in this drought is exceeded only by the drought of the mid-1940s.
A second way of judging the severity of droughts is to look at average rainfall. By that measure, rainfall this year is not as low as in many previous droughts. But, again, if you switch from annual figures to the average rainfall for the previous five years you find that rainfall in the present drought is the lowest on record. So, by one measure at least, you can say it looks like being the worst we've seen. Phew, that's a relief.
This drought is worst in NSW, Victoria and southern Queensland. But some pastoral areas of northern Australia have experienced a significant increase in average rainfall over the past decade, including more recently. (You'll wait a long time before any bushie tells you that.)
Of course, judging the severity of a drought by looking at the lack of rain and the amount of area affected isn't the same as looking at the amount of lost agricultural production. Using the latest forecasts from the Australian Bureau of Agricultural and Resource Economics, the Reserve judges that production of wheat and other cereals may be down by 60 per cent on last year. The biggest fall should be in NSW, though a substantial fall is also expected in the largest wheat-producing state, Western Australia. Wool production is expected to be down 7 per cent, but the production of meat and growing of livestock are likely to be little affected. All told, gross farm product is expected to fall by 20 per cent in 2006-07 compared with last financial year. So, in terms of impact on rural production, this drought is likely to be less severe than the 2002 drought, which saw farm product fall by 26 per cent.
Remember, however, that agriculture accounts for less than 3 per cent of total gross domestic product these days. So a 20 per cent fall in 3 per cent of the economy amounts to a subtraction of about 0.5 percentage points from growth in GDP. Of course, that's just the direct effect of the drought. What about the indirect effects of farmers' reduced incomes and spending on the rest of the economy? Farmers hate it when hard-nosed economists remind starry-eyed city slickers that, thanks to the huge growth in the services sector over the past 30 years, agriculture is now such a small part of the economy (about a quarter the size of our small manufacturing sector). So rural lobbyists like to claim that agriculture has a big "multiplier effect" through the rest of the economy. I think I've heard it claimed that this takes the sector to the equivalent of 12 per cent of the economy. Rubbish. All spending has a multiplier effect through the economy, not just spending by farmers. So this is a trick everyone can play. And if each industry similarly estimated its overall effect on the economy, the figures they gave would total way more than 100 per cent of GDP.
No. The Reserve Bank estimates the drought's direct effect in reducing GDP growth by 0.5 percentage points rises to 0.75 percentage points when you include the indirect effect on other parts of the economy. When you remember that real GDP has grown at an average rate of about 3.5 per cent a year, that loss is significant but not the end of the world.
The drought's likely effect on the economy's growth isn't the same thing as its effect on the incomes of farmers, of course. After allowing for inflation, net farm incomes are expected to decline substantially to around their lowest level in more than a decade. But for many farmers there'll be a saver. The Federal Government runs a farm management deposit scheme where farmers can reduce their income tax in good years by depositing some of their income. They then withdraw that money in bad years, pay tax on it and spend it. The amount farmers have put away in this scheme has grown strongly since 1999 and is now about $2.5 billion, almost the highest it's been. Why have our poor, struggling farmers been able to stash away so much? Because grain growers did so well from the large harvests of recent years, while beef producers did well from the earlier strength in cattle prices.
Another line we are hearing in the combined efforts of farmers, politicians and the media to give city slickers an exaggerated impression of the effects of the drought is that we're about to see big increases in food prices. Nonsense. The effect on prices will be small. Why? Because, for instance, the cost of flour accounts for only a small part of the retail price of bread. And because, though grain prices rise during a drought, meat prices usually fall as more animals are sent to be slaughtered. I'd be more sympathetic if there weren't so many people laying it on too thick.
Source
***************************************
Many people would like to be kind to others so Leftists exploit that with their nonsense about equality. Most people want a clean, green environment so Greenies exploit that by inventing all sorts of far-fetched threats to the environment. But for both, the real motive is to promote themselves as wiser and better than everyone else, truth regardless.
Global warming has taken the place of Communism as an absurdity that "liberals" will defend to the death regardless of the evidence showing its folly. Evidence never has mattered to real Leftists
Comments? Email me here. My Home Pages are here or here or here. For times when blogger.com is playing up, there are mirrors of this site here and here.
*****************************************
A northern Alberta geologist has embarked on a crusade to stop what he says is the madness of the prevailing wisdom that human activity is heating the Earth. "The truth has to start somewhere," said Bruno Wiskel in an interview with the Sun yesterday. Wiskel, who teaches a University of Alberta faculty of extension course, says climate change is an eons-old force that has nothing to do with people. Current global warming, he said, has been going on for about 18,000 years, with glaciers retreating and sea levels rising ever since. "If this happened once and we were the cause of it, that would be cause for concern," said Wiskel. "But glaciers have been coming and going for billions of years."
Wiskel's comments came a day after opposition MPs and environmentalists blasted as inadequate Canada's efforts to combat global warming. A Bonn-based development group, Germanwatch, placed Canada 51st out of 56 countries that were assessed for their performance and policies on climate change.
Wiskel says climate change has gone "from a science to a religion" that preaches carbon dioxide from human activity is to blame for increasing temperatures - something with which he soundly disagrees. He blamed people grubbing for research dollars for perpetuating what he says is a myth. "If you funnel money into things that can't be changed, the money is not going into the places that it is needed."
Wiskel, touting his latest book The Emperor's New Climate: Debunking the Myth of Global Warming, teaches a U of A course called Building an Energy Efficient Home for Less. He started to research climate change while building a "Kyoto house" in which he now lives near Athabasca, about 150 km north of Edmonton. He claims his house is 5,500 square feet and uses less than 10% of the natural gas that a regular home in Edmonton would use. In building the house, he says, he was seeking to prove that Kyoto Protocol targets could be met by people making small changes in their lives, without touching industry. Instead, he said he realized global warming theory was full of holes and "red flags," and became convinced that humans are not responsible for rising temperatures.
Source
Every silver lining has a cloud
A freelance science writer asks why greens seem so opposed to one scientist’s proposal for stabilising global temperatures
Little is certain in the field of global climate prediction. But one thing is for sure: if all those worst-case scenarios made so much of by environmentalists come true, we really are screwed. So you might expect those same environmentalists to be rather excited by a project that claims to be able to stabilise global temperatures at the push of a button, and keep them stable while the world makes the transition to energy sources of the future. Except that they’re not. In fact, if their reaction to the project is anything to go by, either they don’t believe their own press releases, or trying out new things in order to save the planet is not one of their top priorities.
There has been no shortage of suggestions over recent decades for large-scale ‘engineering fixes’ for global warming, some more outlandish than others. They have ranged from seeding the oceans with iron filings to draw down atmospheric CO2, to the launching of billions of aluminised balloons to reflect the sun’s rays away from the Earth, to the installation of giant mirrors in space that intercept those rays before they reach us. Atmospheric physicist John Latham’s idea is perhaps more down-to-Earth than most, although whether it can provide a ‘solution’ to climate change remains very much up for debate. In the 1980s, Latham, professor emeritus at Manchester University, and now at the National Center for Atmospheric Research in Colorado, realised that the Earth already had the hardware in place for reflecting sunlight back into space.
While some types of cloud have an insulating effect on the planet, others, such as the low-altitude stratocumulus variety that covers much of the world’s oceans, reflect incoming sunlight. Latham’s idea, which he first published in the science journal Nature in 1990, is to make the silver linings of those stratocumulus clouds a little bit more silvery, by injecting salt crystals into the atmosphere to seed the formation of the water droplets that comprise them. In this way, he claims, ‘one can produce a degree of cooling in a controlled way, to try and balance the warming produced by the burning of fossil fuels’. He calculates that to achieve the desired effect on cloud reflectivity would require treating them with ‘a cupful’ of salt per km2 per hour.
‘It’s a very interesting idea, and one that is based on sound cloud physics’, says Alan Gadian, climate scientist at the University of Leeds. He is impressed that, because the technique would be augmenting a natural process (breaking waves are constantly throwing vast quantities of salt up into the atmosphere), it carries relatively little risk. And should things go awry, he says, ‘you could just stop producing these salt crystals and the system would return to its normal state’. John Shepherd, director of the University of Southampton’s Earth System Modelling Initiative, agrees. ‘In principle, the idea is sound’, he says. ‘The big question is whether they can get enough sea salt nuclei into the atmosphere.’
And that’s down to Stephen Salter, professor of engineering at the University of Edinburgh, who is best known for his invention of ‘Salter’s duck,’ a device for harnessing energy from waves. For the current project, he has designed a fleet of specialised ocean-going yachts. ‘They’ll look like steam ships with big funnels’, he says. But these are no ordinary funnels. They will be spinning rapidly on their vertical axis, a feature that serves two important functions.
The first is propulsion. When wind hits a spinning cylinder, it generates a sideways thrust. As well as allowing the boats to be positioned optimally, this force would propel them fast enough to drive a water turbine that powers the conversion of seawater into a very fine mist. As the mist rises, the water evaporates from the droplets to leave the airborne salt crystals. To do their job, the crystals must be within a narrow size range, which means producing droplets that are consistently about one millionth of a metre in diameter. This will involve vibrating the surface of a seawater reservoir to create a network of fine ripples. ‘If you make these ripples big enough, drops are thrown off’, says Salter. The size of those drops is determined by the frequency of the vibrations.
And there lies another technical challenge. To produce the ripples, the surface of the seawater reservoir must be smooth – not easy to achieve on a pitching, rolling boat. This is where the spinning funnels really come into their own. They will be filled with seawater, which gets thrown against the walls by centrifugal force, producing a smooth, vertical surface on which the ripples can be generated. Fans inside the funnels will then blow the resulting mist up into the sky like smoke rising from a chimney.
The yachts will carry no crew, but will be controlled via satellite. Salter estimates that a fleet of up to 40,000 of these hi-tech Mary Celestes would be required to offset the temperature rise predicted to result from a doubling in atmospheric CO2. Even if CO2 concentrations were to increase according to worst-case scenarios, this, he estimates, would provide several decades’ respite – which might provide time to develop non-carbon energy sources; research the intricate workings of climate systems; and plan long-term strategies to cope with a changing climate.
It would also be relatively cheap. ‘I can’t see these things being more than a million quid a go’, says Salter. That still adds up to £40billion. However, the investment would be spread over the time it takes for CO2 to double. ‘You’d only need to spend perhaps three per cent of that every year to stabilise things’, says Salter. ‘That would be an incredible bargain.’ Indeed, it is a tiny fraction of the expense of the Kyoto Protocol, for example, which is expected to shave off just a few tenths of a degree of temperature rise over the next hundred years.
Stabilisation of global temperatures? Little risk? At a fraction of the cost of Kyoto? It sounds like it at least worth trying, and it sounds like an environmentalist’s wet dream. So why are green organisations so unimpressed with the idea? ‘It’s one of those crazy engineering solutions to climate change that we ignore really’, says Friends of the Earth (FoE) climate campaigner Bryony Worthington. ‘It’s not something we think we should be spending money and time on.’ Worthington denies she’s being dismissive. ‘It’s not a question of being dismissive; it’s a question of whether this is worth any time and effort even thinking about.’
Over at Greenpeace, Mark Strutt, who was until recently senior climate campaigner at Greenpeace UK (he’s now Greenpeace International’s agriculture spokesperson), takes a similar stance. ‘Greenpeace wouldn’t be interested in this sort of thing. We’re looking for reductions in the use of fossil fuels rather than these technologies that in all likelihood would come to nothing.’
Of course, the project might indeed come to nothing. There are good reasons to think that we cannot control the climate – a chaotic system influenced by a host of inputs – by tweaking a single variable. And yet tweaking a single variable – CO2 emissions – is precisely what environmentalists are themselves urging us to do. However, the environmentalist case against engineering fixes for global warming does not rest on the underlying science. It has more to do with a view of science as the cause of the world’s problems, and not something that might provide a solution. ‘We don’t take these ideas very seriously because the idea that we’ll somehow come up with a man-made fix is fanciful’, says Worthington. This sentiment is echoed by Charlie Kronick, Greenpeace UK’s climate change coordinator. ‘The idea of interfering with another natural system to compensate for the nearly catastrophic interference we’ve already done is not an enticing prospect’, he says.
Despite these seemingly Luddite sentiments, Worthington claims to have science on her side. ‘The models are showing that reducing the concentrations of greenhouse gases is the only sensible response to climate change.’ Really? Latham has been collaborating with the UK Meteorological Office to test the theory behind his project using their powerful computer model of global climate. This suggested that treating clouds covering just three per cent of the Earth’s surface would cool the planet sufficiently to compensate for a doubling of CO2. Alan Gadian is sufficiently impressed that he is now embarking on a project to replicate that study.
It is at this point that Worthington is forced to express her discomfort with the very models on which the environmental case depends. ‘But he can’t be certain’, she says, ‘they’re only models.’ Yes, and green activists’ predictions of climate change disaster are also based on models.
There may be other reasons for FoE and Greenpeace’s discomfort with such projects. After all, a successful engineering fix would deprive the green movement of its most valuable political currency – urgency. If the world were to have a few decades of stable temperatures, the urgency of green politics would have to give way to a genuine, rational political debate. Their discomfort also points to a lack of faith in man-made solutions; we are seen as giving rise to climate chaos and thus must apparently take a hands-off approach from nature.
Engineering the climate might yet prove impossible, for scientific or practical reasons. Latham’s team is now planning a small-scale pilot experiment further to explore the project’s viability. ‘We don’t know yet what fraction of the drops we make will actually get up to where the clouds are’, says Salter. But there is surely something noble about the aspiration to control the climate. We don’t need climate models to tell us that Mother Nature has plenty to throw at us, whether or not the planet warms as predicted. And in that respect, projects such as Latham’s could be seen as valuable developments, regardless of whether the elements have even more nasty surprises in store for us.
No doubt environmentalist groups would abhor the prospect of controlling the Earth’s climate on the basis that, in the words of Kronick, we’d be interfering in a ‘natural system’. Environmentalists’ aspirations are very different: through rain or shine, they seem determined to stick to the mantra that we should be reducing CO2 emissions and, in doing so, leave us even more vulnerable to the whim of Mother Nature. Worthington and Strutt both claim that the search for engineering fixes for global warming only serves as a distraction, making people and governments less inclined to reduce CO2 emissions. And yet Worthington herself doesn’t seem to have much faith that reducing emissions will be particularly effective: ‘If we can see global CO2 emissions peak and decline in the next 10 to 15 years, we’ve still got a slim chance of holding [temperature increases] down to two degrees’, she says.
A slim chance of avoiding climate catastrophe? Environmentalists, it seems, don’t need any help when it comes to disinclining the world to reduce carbon emissions.
Source
CLIMB-DOWN: EU SAYS RADICAL CHANGES TO EMISSIONS TRADING SCHEME WILL WAIT UNTIL 2013
And that the scheme so far has done little
The European Commission said Monday that any radical changes to its carbon dioxide emissions trading program would have to wait until 2013. The program includes a plan to bring airlines into the scheme and link up with trading in other parts of the world - including several U.S. states. It said it wanted to expand the scheme to new sectors and gases, giving few details beyond mentioning aviation and methane released from coal mining and nitrous oxide from ammonia production. It would also examine how it could count more carbon capture initiatives.
In a report, the EU executive suggested a single EU cap on emissions after 2012, replacing 25 separate targets put forward by each EU nation. The report said the EU would look into similar trading programs in other countries and will see how they could link up with the European Union. Several U.S. northeastern states have formed an initiative to cut carbon dioxide emissions, and California is moving in the same direction. However, formal plans will only be put forward in late 2007 after experts report back next June, it said.
The EU report acknowledged that the first years of the scheme have been disappointing as some governments gave out too many allocations, meaning industry made few real efforts to cut back. "Robust compliance and enforcement" is needed, it said, including independent checks on emissions reports. On paper, the scheme was a success last year as less emissions were released than expected. But the report discounted that, blaming targets that were too high. "However to the extent that it reflects an overestimate of baseline emissions, it means that the environmental outcome of the scheme in the first period will not be as large as it could have been or as large as will be necessary to adequately address climate change," it said.
The commission is fine-tuning plans for the second stage of the program that will run from 2008 to 2013.
Source
DARN DROUGHT DATA
We have all heard the news that droughts will certainly become longer, more frequent, and more severe thanks to global warming. Higher temperatures will surely increase rates of potential evapotranspiration, and even if precipitation patterns remain unchanged, the odds will favor more droughts in the future. The Intergovernmental Panel on Climate Change (IPCC) states in the 2001 Summary for Policymakers that it is "Likely" that "Increased summer continental drying and associate risk of drought" has occurred in the later half of the 20th century and "Likely, over most mid-latitude continental interiors" to occur during the 21st century.
Figure 1 below shows the current state of affairs as of November 4, 2006, and generally, widespread drought in the mid-latitude continental interior is absent. In fact, as we look at the Great Plains, we find more areas in the "Extremely Moist" category than the "Extreme Drought" category. We would all agree that one snapshot of soil moisture conditions in the United States is not an adequate way to test the idea that global warming will lead to an increase in drought in mid-latitude continental interiors. What is needed, of course, is a longer perspective with drought information over hundreds of years.
Our wish for longer term information on drought in the United States has come true given a recent article in The Holocene. Celine Herweijer and her associates at the Lamont-Doherty Earth Observatory at Columbia University used a combination of proxy data (e.g., tree-ring data), historical accounts, limited instrumental records, and climate models to reconstruct the drought patterns of the past. Not surprisingly, they found "The two major long-lasting droughts of the 1930s and 1950s covered large areas of the interior and southern states and have long served as paradigms for the social and economic cost of sustained drought in the USA. Both had severe environmental and social impacts, in the Great Plains and southwest, respectively." Note that the two major drought periods occurred 50 to 70 years ago, long before the celebrated global warming of the last three decades.
The team states "These events are not unique to the twentieth century" and that "three distinct periods of widespread and persistent drought stand out in these records for the latter half of the nineteenth century: 1856-1865, 1870-1877 and 1890-1896." Note that these three drought periods occurred during the Little Ice Age which was anything but a period of warmer temperatures. Furthermore, Herweijer et al. note that "Analysis of mid- to late-nineteenth century instrumental and proxy records from the tropical Pacific reveal prolonged La Nina-like conditions during each of the persistent droughts:1856-1865, 1870-1877 and 1890-1896." In case you have forgotten, El Nino is the condition that is associated with warm water in the eastern Pacific and La Nina is a period with exceptionally cold water in the eastern Pacific. So the droughts of the 19th century not only occurred during a cold century, but they occurred in relatively cold periods of that century (Figure 2).
The team expands on this link to cold sea-surface temperatures (SSTs) stating "It is well known that changes in the configuration of tropical SSTs on interannual timescales can strongly influence extratropical precipitation: during La Nina winters there is reduced precipitation across much of the northern subtropics and mid-latitudes, with large deficits in particular in the southwest USA, extending into the Great Plains" and that "persistent drought conditions in the Great Plains were primarily influenced by the tropical part of the SST forcing, with a tendency for drought when the tropical Pacific SSTs are cold." They also note that "During each of the mid- to late-nineteenth century droughts, the upper tropospheric geopotential heights are lowered in the tropics consistent with cooling at these latitudes."
Next, the team explored droughts that may have occurred 1,000 years ago during what they called the Mediaeval period (not to be confused with the current Media Evil period). Coral provide proxy information about the past sea surface conditions, and they used a coral-based reconstruction to demonstrate "the potential link between a colder eastern equatorial Pacific and the persistent North American droughts of the Mediaeval period." They found "that the present multiyear drought in the western USA pales in comparison with a 'Mediaeval Megadrought' that occurred from AD 900 to AD 1300. This drought reconstruction also shows an abrupt shift to wetter conditions after AD 1300, coinciding with the 'Little Ice Age', a time of globally cooler temperatures, and a return to more drought-prone conditions beginning in the nineteenth century."
It becomes obvious that major droughts occur during warm and cold periods, but the evidence suggests that relatively cold periods in the tropical Pacific control prolonged droughts in the United States, whether at present, during the Little Ice Age, or during the Mediaeval Warm Period 1,000 years ago.
Since some climate models suggest El Nino will be more frequent than La Nina in the future, perhaps the outlook for future droughts is not so dreary!
Source
The truth about Australia's latest drought
By economist Ross Gittins. He doesn't even mention global warming, funnily enough
Talking to farmers about drought is like talking to fishers about the one that got away. This one is always much bigger than those that went before. And since the hyperbole merchants told us the drought of 2002 was the biggest in 100 years, this one must be the biggest in 1000 years. Yeah, sure. Thank goodness for the assessments of narky economists, who don't try to humour farmers the way ingratiating politicians and a superlative-seeking media do.
The Reserve Bank offered a dispassionate assessment of the likely severity of the drought in a statement last week. It's pretty bad, but not as cataclysmic as some would have us believe. The severity of droughts can be judged in different ways. One way is to compare the share of the nation's prime agricultural land suffering deficient rainfall this year with previous years. By that measure this one seems less severe than the droughts at the time of Federation, in the 1940s and early 1980s and in 2002. It's significant, however, that this drought comes so hard on the heels of the 2002 drought, thus limiting the opportunities for recovery in growing conditions and water storage. One way to account for this factor is to take for each year the average degree of drought-affected land during the previous five years. Measured this way, the area of land with deficient rainfall in this drought is exceeded only by the drought of the mid-1940s.
A second way of judging the severity of droughts is to look at average rainfall. By that measure, rainfall this year is not as low as in many previous droughts. But, again, if you switch from annual figures to the average rainfall for the previous five years you find that rainfall in the present drought is the lowest on record. So, by one measure at least, you can say it looks like being the worst we've seen. Phew, that's a relief.
This drought is worst in NSW, Victoria and southern Queensland. But some pastoral areas of northern Australia have experienced a significant increase in average rainfall over the past decade, including more recently. (You'll wait a long time before any bushie tells you that.)
Of course, judging the severity of a drought by looking at the lack of rain and the amount of area affected isn't the same as looking at the amount of lost agricultural production. Using the latest forecasts from the Australian Bureau of Agricultural and Resource Economics, the Reserve judges that production of wheat and other cereals may be down by 60 per cent on last year. The biggest fall should be in NSW, though a substantial fall is also expected in the largest wheat-producing state, Western Australia. Wool production is expected to be down 7 per cent, but the production of meat and growing of livestock are likely to be little affected. All told, gross farm product is expected to fall by 20 per cent in 2006-07 compared with last financial year. So, in terms of impact on rural production, this drought is likely to be less severe than the 2002 drought, which saw farm product fall by 26 per cent.
Remember, however, that agriculture accounts for less than 3 per cent of total gross domestic product these days. So a 20 per cent fall in 3 per cent of the economy amounts to a subtraction of about 0.5 percentage points from growth in GDP. Of course, that's just the direct effect of the drought. What about the indirect effects of farmers' reduced incomes and spending on the rest of the economy? Farmers hate it when hard-nosed economists remind starry-eyed city slickers that, thanks to the huge growth in the services sector over the past 30 years, agriculture is now such a small part of the economy (about a quarter the size of our small manufacturing sector). So rural lobbyists like to claim that agriculture has a big "multiplier effect" through the rest of the economy. I think I've heard it claimed that this takes the sector to the equivalent of 12 per cent of the economy. Rubbish. All spending has a multiplier effect through the economy, not just spending by farmers. So this is a trick everyone can play. And if each industry similarly estimated its overall effect on the economy, the figures they gave would total way more than 100 per cent of GDP.
No. The Reserve Bank estimates the drought's direct effect in reducing GDP growth by 0.5 percentage points rises to 0.75 percentage points when you include the indirect effect on other parts of the economy. When you remember that real GDP has grown at an average rate of about 3.5 per cent a year, that loss is significant but not the end of the world.
The drought's likely effect on the economy's growth isn't the same thing as its effect on the incomes of farmers, of course. After allowing for inflation, net farm incomes are expected to decline substantially to around their lowest level in more than a decade. But for many farmers there'll be a saver. The Federal Government runs a farm management deposit scheme where farmers can reduce their income tax in good years by depositing some of their income. They then withdraw that money in bad years, pay tax on it and spend it. The amount farmers have put away in this scheme has grown strongly since 1999 and is now about $2.5 billion, almost the highest it's been. Why have our poor, struggling farmers been able to stash away so much? Because grain growers did so well from the large harvests of recent years, while beef producers did well from the earlier strength in cattle prices.
Another line we are hearing in the combined efforts of farmers, politicians and the media to give city slickers an exaggerated impression of the effects of the drought is that we're about to see big increases in food prices. Nonsense. The effect on prices will be small. Why? Because, for instance, the cost of flour accounts for only a small part of the retail price of bread. And because, though grain prices rise during a drought, meat prices usually fall as more animals are sent to be slaughtered. I'd be more sympathetic if there weren't so many people laying it on too thick.
Source
***************************************
Many people would like to be kind to others so Leftists exploit that with their nonsense about equality. Most people want a clean, green environment so Greenies exploit that by inventing all sorts of far-fetched threats to the environment. But for both, the real motive is to promote themselves as wiser and better than everyone else, truth regardless.
Global warming has taken the place of Communism as an absurdity that "liberals" will defend to the death regardless of the evidence showing its folly. Evidence never has mattered to real Leftists
Comments? Email me here. My Home Pages are here or here or here. For times when blogger.com is playing up, there are mirrors of this site here and here.
*****************************************
Subscribe to:
Posts (Atom)


 Jim Hansen and his twin


